Past extreme sea levels
Investigating past extreme sea levels
Tide gauge data can be used to investigate recorded extreme sea levels for pre-satellite historical periods. Data from Australia’s longest two tide gauge records (Fremantle and Fort Denison) indicate that extreme sea levels are increasing more rapidly than median sea levels.
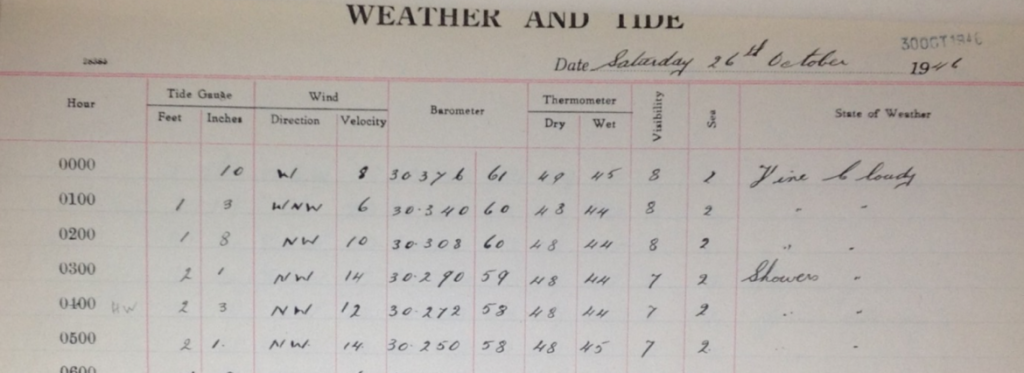
The remaining Australian tide gauges have much shorter digital records, which makes analysis of extreme sea levels difficult. However, the SLWCE team is coordinating a citizen science project to digitise tide gauge data presently available as paper charts for tide gauges from around Australia, starting with Williamstown (Melbourne). The project will extend the temporal and coastal coverage of digital tide records, enabling more comprehensive studies on variability and trends in Australian extreme sea levels. For more information, see citizen science tide digitisation.

Analysing historic trends in waves is more challenging because of the relatively few long-term wave buoy observations around Australia, however a study of satellite altimeter observations from 1991 onwards indicated a strong positive correlation between significant wave heights in the Southern Ocean and the Southern Annular Mode (SAM), particularly during autumn and winter (Hemer et al. 2010).
Physical impact of extreme sea levels
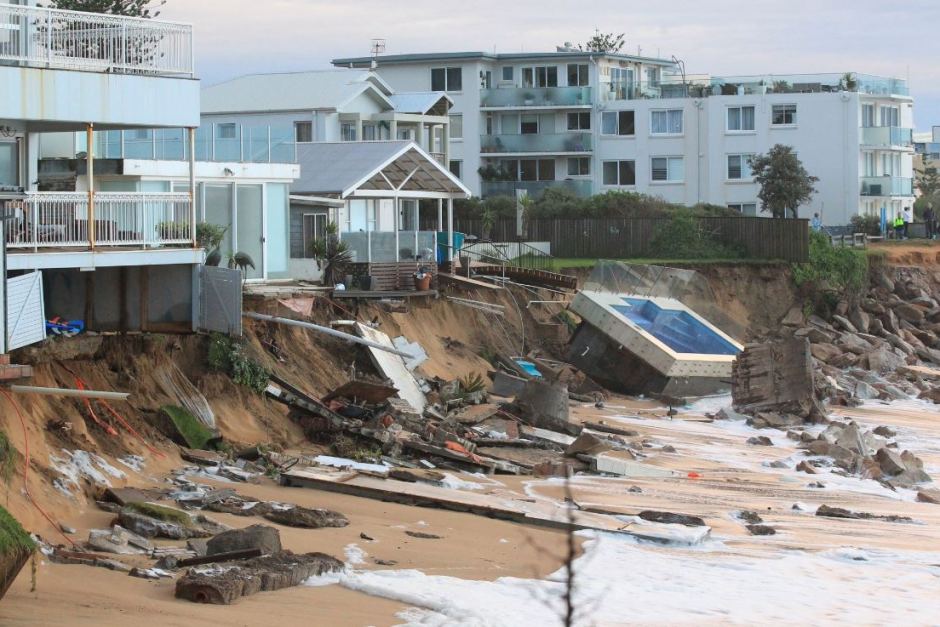
Damage sustained at Collaroy Beach in June 2016 as a result of an East Coast Low and one of the highest tides of the year. Photo credit: Fairfax Media, Peter Rae

