Tide Gauge Digitisation Project – Citizen Science
Text based on National Environmental Science Programme – Earth Systems and Climate Change Hub blog 11th September 2017
On average, global sea level has risen over 20 cm since the late 19th century and it continues to rise at around 3.3 mm/year. However, the rise is not uniform. It varies from year to year and place to place due to the natural variability of the climate system. Satellite observations since 1993 show that sea-level rise rates on the central east and southern coasts of Australia have been in line with the global average, while rates are higher to the north, west and south-east of the continent.
As sea levels rise, the effects of high tides and storm surges are becoming greater. These effects also vary from place to place, and Australia’s extensive coastline experiences extreme sea levels from a variety of tropical to mid-latitude weather systems, each of which themselves may be affected differently by climate change.
Long-term tide records of high temporal (e.g. hourly) resolution allow us to not only better understand how mean sea level has changed in the past but also understand how extreme sea levels such as storm surges have changed along with the weather systems that cause them. A greater understanding of past change builds confidence in projections of future change. At present, Australia has only two such records available digitally – Fort Denison, Sydney (with data from 1912) and Fremantle, Perth (with data from 1880). Other long-term records exist, but the data is recorded in old charts (marigrams) and books and so is unavailable for modelling and analysis.
Unlocking old data
A project is underway to digitise these old hard-copy records so the data they contain can be used to analyse how extreme sea levels in Australia have changed over time.
Undigitised tide records are available for Newcastle (NSW), Mackay and Townsville (Qld), Point Lonsdale, South Channel Pile and Williamstown (Vic), Burnie and Georgetown (Tas) and Albany, Bunbury and Geraldton (WA).
Efforts are ongoing, in partnership with the relevant state authorities, to locate all historic records. Many available records are now stored at CSIRO for the purpose of digitising.

The Williamstown record is the first cab off the rank for digitisation for a number of reasons. As well as having marigrams that extend back the furthest (to 1875), Williamstown has a near-complete set of tide registers (books containing the measured daily high and low waters) from 1872.
Williamstown’s location on the south coast also means it is exposed to different meteorological causes of extreme sea levels, so tide information from here can increase our understanding of the local surge-generating storm systems.
Historical sources
Williamstown
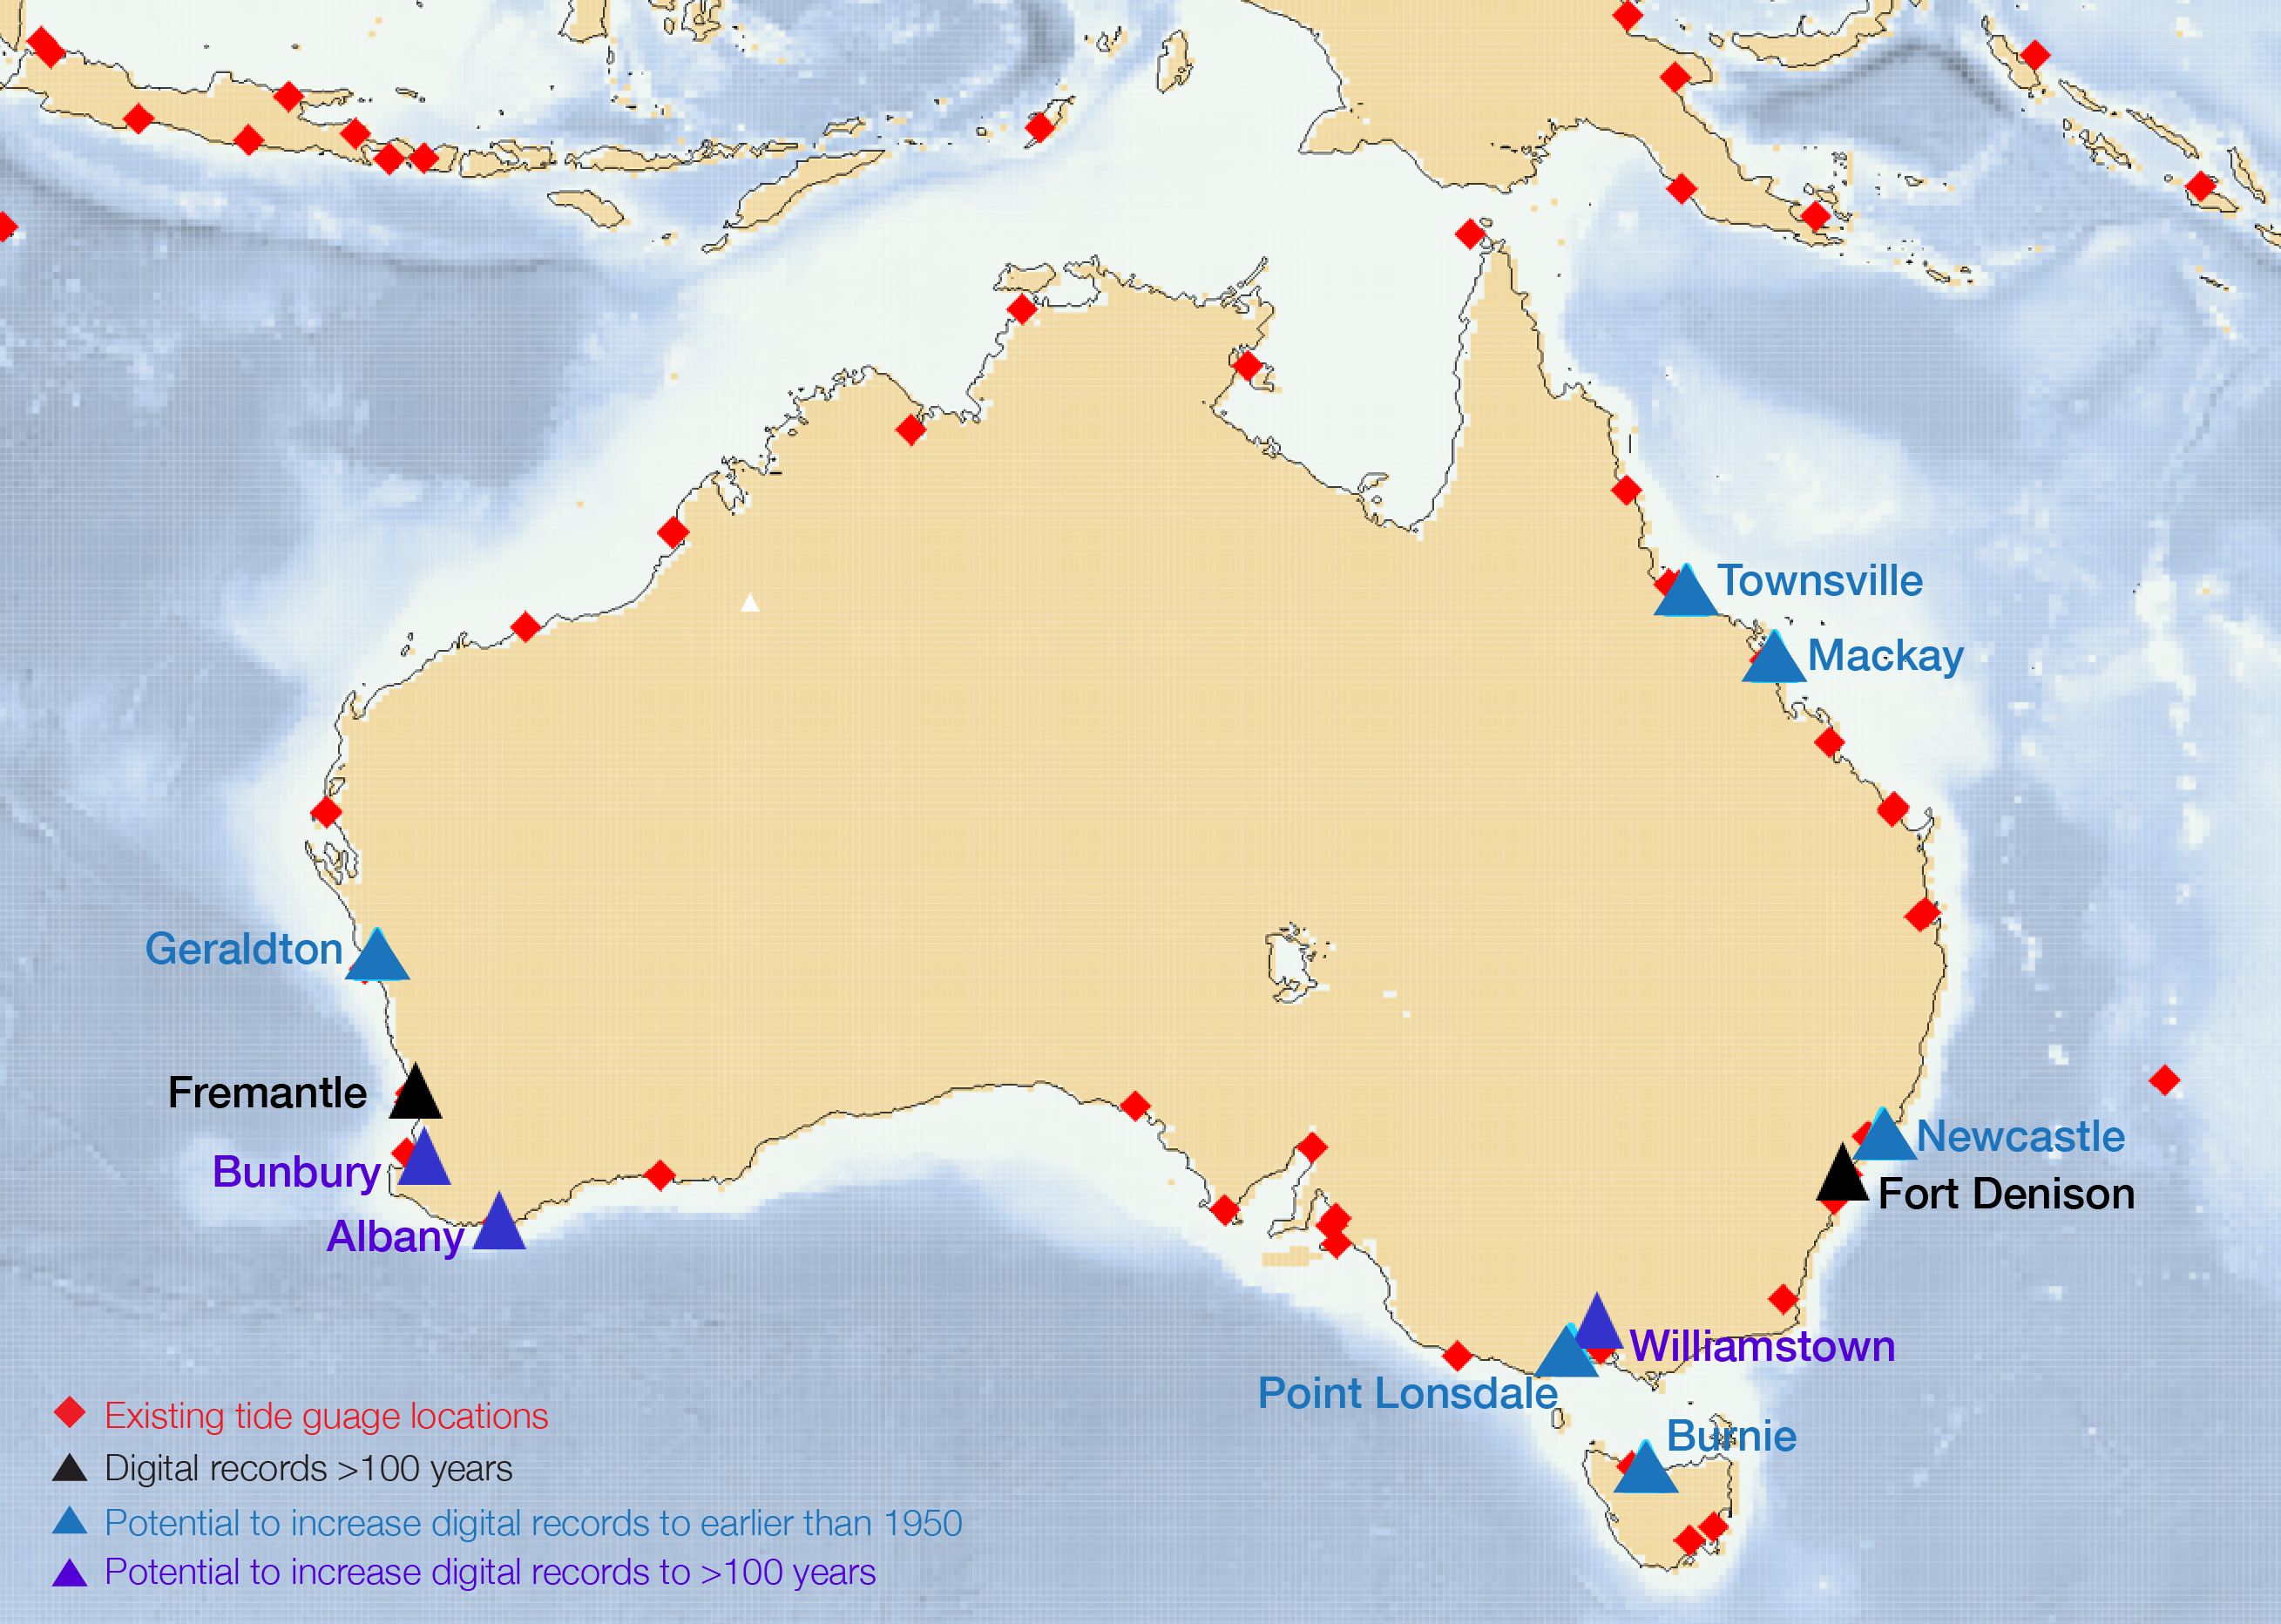
The Williamstown marigrams record tide data from 1875 until 1965 when the digital record began (although the charts from 1946–1949 are missing). In total, there are around 22,000 charts which can be digitised.
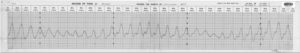
The format of the charts differs through time. For the most recent records (1950–1965), chart paper covering four days was used with two charts covering a week.
From 1926-1945, the same chart type was used but was kept on the gauge for the full week resulting in two overlapping curves.
Prior to 1926, a single chart was used each day.
The marigram data is complemented by two other sources of data from the Port of Melbourne Authority.
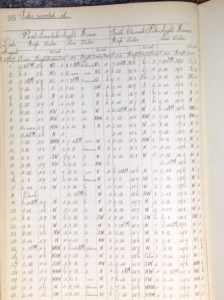
The first is a series of tide register books containing daily high and low water levels from 1872 through to the mid-1970s (except for a gap from September 1940 to August 1943). The second source is a set of books containing hourly tide and weather observations from September 1943 to December 1948 taken at Williamstown’s Breakwater Pier. These records provide an additional source of data to infill gaps in the marigrams due to faults in the tide gauge or damaged or missing marigrams. The registers also provide additional metadata and datum information.
The tide register books of high and low water levels are much quicker to digitise than the marigrams, and contain sufficient information that after some experimentation, we decided to treat these as the primary record for digitising, and only add in marigram data where it will add value to the data record.
Point Lonsdale and South Channel Pile
Tide data from the Point Lonsdale lighthouse and the nearby South Channel Pile lighthouse were recorded in the same tide book. High and low water levels were documented between 1906 and 1910. Tide records post-1910 are still being sought.
Albany
At present, the Albany marigrams we have access to are from 1951-1966. These marigrams differ from Williamstown by recording one month per chart. The records prior to 1951 were stored separately and are still being tracked down.
Georgetown
The Georgetown marigrams have proven to be the most challenging to digitise so far. Digitising has begun on marigrams from 1956 through to 1965. There are two separate formats; both containing weekly data. From 1956 to 1958, each chart contains a single trace for the week. Between 1959 and 1965, the daily chart contains seven separate traces!
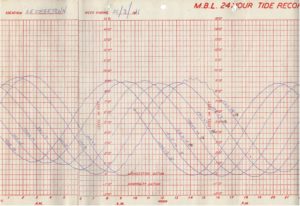
Following digitisation, the data is loaded into a high performance computer, and can be plotted against mathematically predicted tide values for quality control and checking for errors in the digitised data. These plots also show storm surge events and other extreme sea level features of scientific interest.
In this chart type, used at Williamstown from 1926 to 1945, the curves for one week overlap. 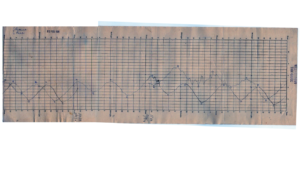 Early Williamstown charts recorded one day to a sheet.
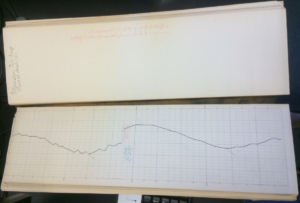
Tide gauge datum information page, 1890-1896. 
High and low tide registers, Williamstown January-April 1922. 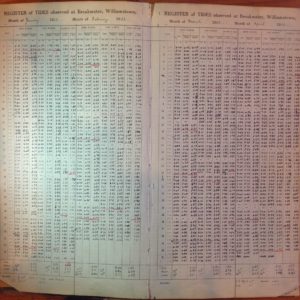
Point Lonsdale and South Channel Pile tide register, August 1907
Albany marigram, December 1959
Georgetown marigram, March 1961
Getting down to digitising
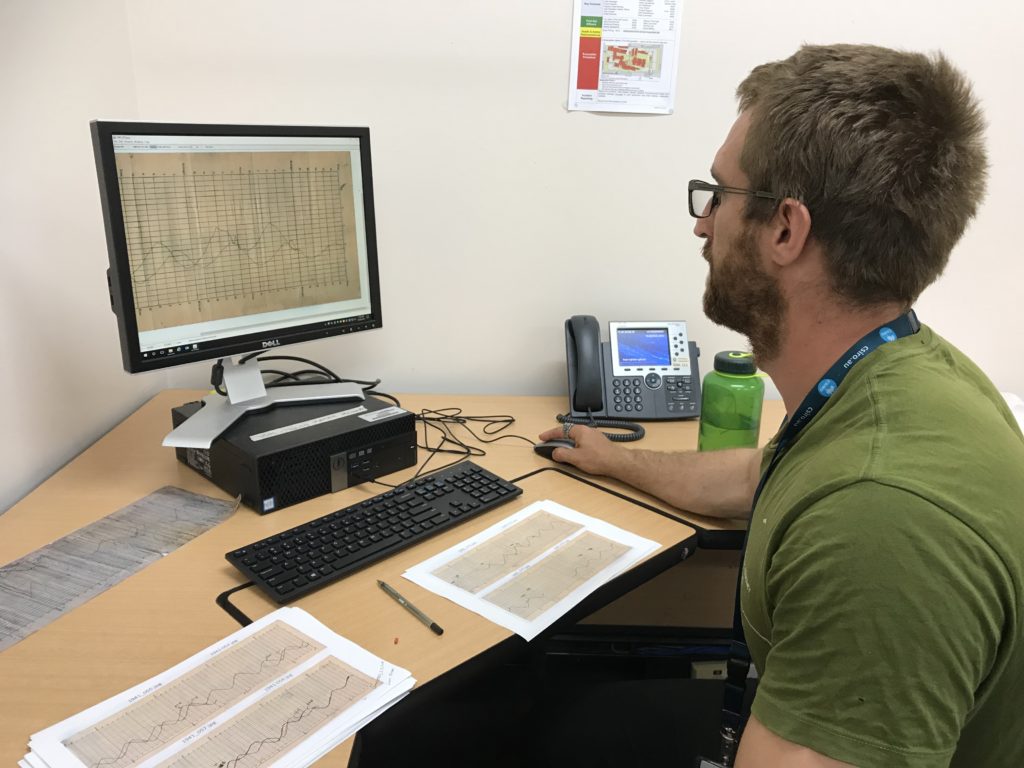
Translating these charts into digital data is a time-consuming business. Each marigram is scanned and digitisation software used to click along the trace representing water level to convert it into a digital record. The data is converted to the relevant vertical height datum graphed and checked for errors before being further processed and interpolated to a regular time interval. The data from the tide registers and tide and weather books are entered into spreadsheets. Due to the nature of the old records, these activities cannot be automated and all have to be carried out by hand.
Results
All available Williamstown registers, tide books and relevant marigrams (back to 1940) have been digitised. This newly digitised data has been concatenated with the available digital record from 1966 sourced from GESLA. For the years where the three types of digital data are available, the hourly tide book and register data show close agreement to each other whereas the marigram data exhibits small deviations from these other forms of data. Prior to March 1909, datum corrections are not readily available and further investigation is required.
Where to next?
Digitising has commenced on records from Albany, Point Lonsdale, South Channel Pile and Georgetown. But there are many more records to go!
Get involved!
Much of the digitisation to this point has been carried out by a small team of student volunteers and through high school work experience students.
Digitising the records is not difficult, but does require attention to detail and some preliminary training from our sea-level researchers.
If you have a reliable internet connection, access and familiarity to Microsoft Excel and Java, an interest in understanding our changing climate and some time to spare, please get in touch with Kathy McInnes or Rebecca Gregory to find out more.
What our digitisers have said about the project
“I just wanted to thank you and Julian so much for taking me for work experience last week. I really enjoyed learning about the different sciences, your facilities and the work you do at CSIRO. I hope the work that I did will be useful for you.” – Jessica Gibson, Mentone Girls Secondary College
“Thanks Kathy and Claire for making this week so interesting. I have definitely benefited from the experience and look forward to meeting you again.” – Michael Whelan, John Monash Science School
“Just wanted to say thanks again for the great week of work and opportunities. I feel that I have gained a lot from the experience and will be able to apply my new knowledge elsewhere. Thanks so much to everyone involved (especially Kathy and Claire) who made this week interesting, and I look forward to meeting again in the future.” – Khy Rasmussen, John Monash Science School
“Thank you for sending the tide digitisation, it’s really cool to see how it turned out and how it is being used.” – Jessica Gibson, Mentone Girls Secondary College
‘I do really enjoy the work experience week! The work experience week is inspirational, and I learnt many different things during the week. The lab talks and the Bureau visit are really interesting, and make me understand the working environment of scientists. Those provide me valuable experience to shape my future career. Please also tell my thanks to Max and Vanessa.’ – Yonghan Wang, McKinnon Secondary College
‘I just wanted to say a massive thank you for having me this week. I found working at CSIRO an incredibly rewarding experience. I especially liked being able to hear about the different work and studies conducted by different people in Aspendale. Thanks for all the work you did for us to be able to do work experience (including the BOM excursion) and I took a lot from it.’ – Zac Warton, Yarra Valley Grammar
‘I really enjoyed the whole week at CSIRO and had a really great time. Thank you so much for organising everything and providing such a great program for us.’ – Emma Zhong, MacRobertson’s Girls High
Volunteers to date are included on publications related to this project.
Liam O’Mara, volunteer
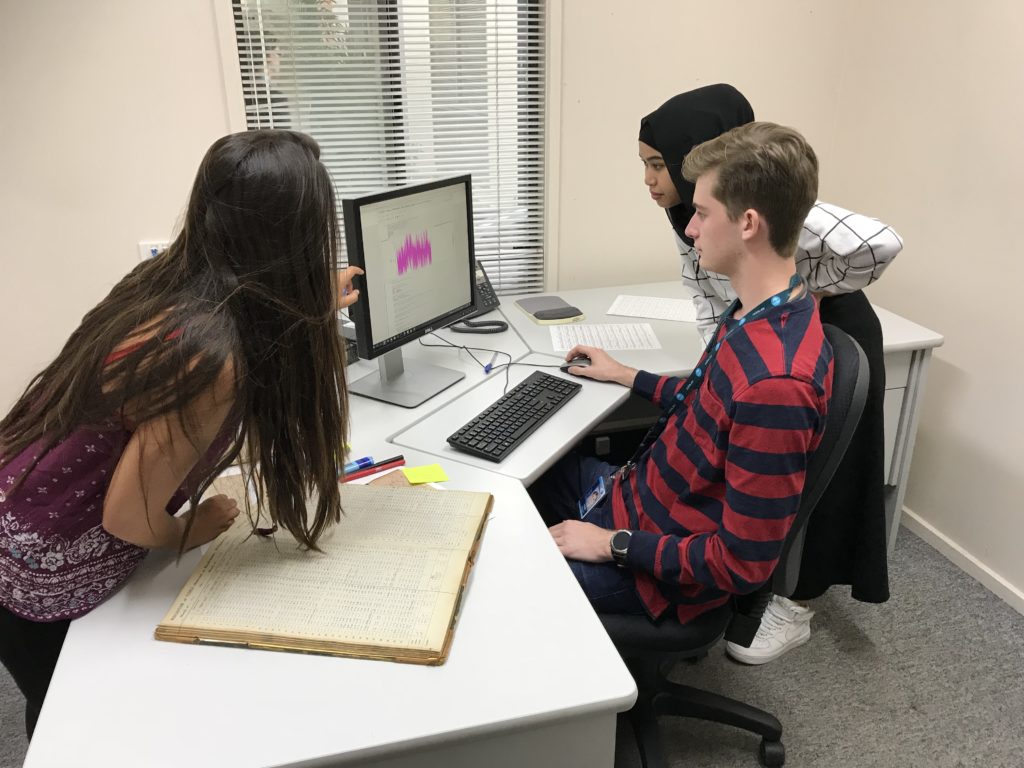
Ana, Ifa and Matt – University students
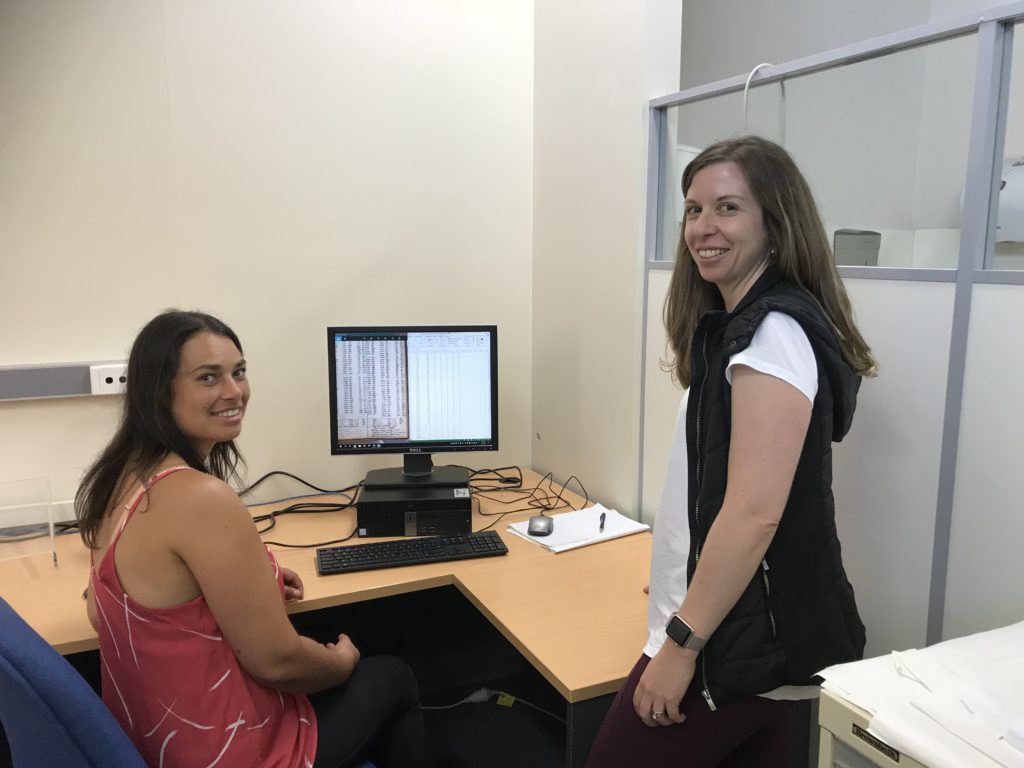
Natasha van Leeuwen and Rebecca Gregory
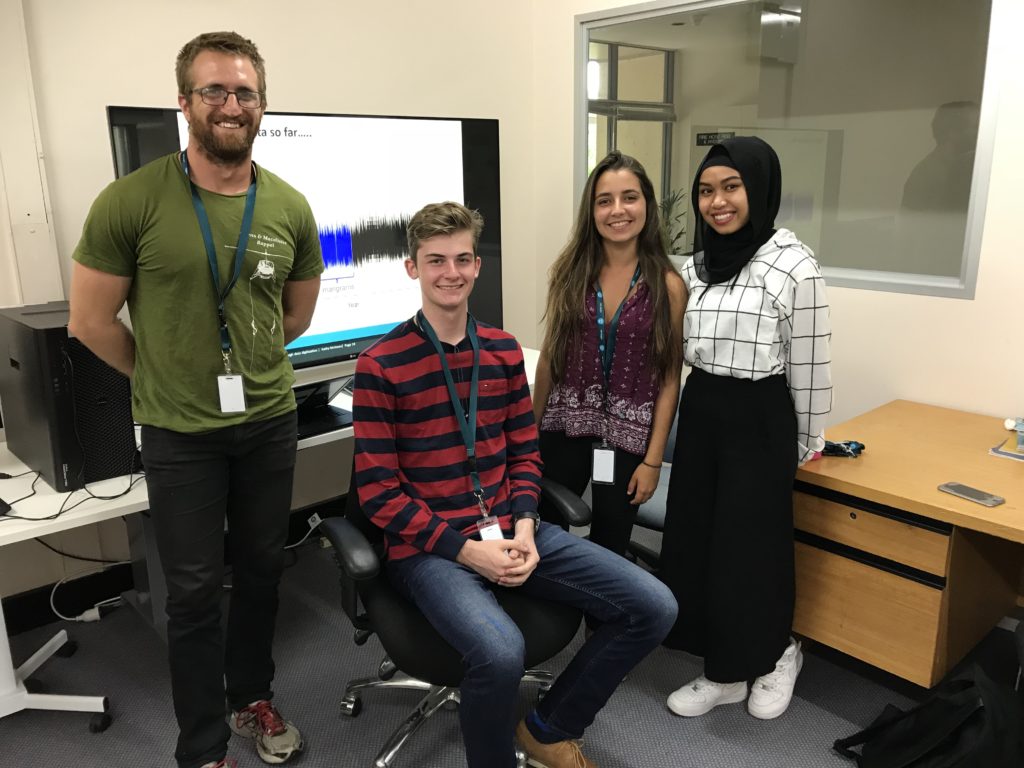
Liam Matt, Ana and Ifa – digitising team, February 2018.
Thanks to all our digitisers!!
| Ben Haigh | Laura Bailey | Martin Fielke | Merlin Barnes |
| Jessica Gibson | Khy Rasmussen | Michael Whelan | Liam O’Mara |
| Matt Bailey | Ushifa (Ifa) Safitri | Ana Wasielesky | Natahsa van Leeuwen |
| Zoe Carr | Lily Hernan | Vidhun Perera | James Vicendese |
| Megan Tildesley | Xander Morgan | Thomas Yeung | Huon Diggins |
| Will Peake | Chloe Pandaleon | Laetitia Leary | Vaishnavi Tiruvoipati |
| Shishir Kulkarni | Saxbee Affleck | Alyssa Schneider | Sam Bloxham |
| Aidan Boyd | Matthew Wade | Dane Breen | Millie Clarke |
| Clare Drinnan | Andrew Widhibrata | Jack Bradley | Lachlan Butcher |
| Poppy Clout | Yonghan Wang | Zachary Warton | Hattie Piastri |
| Riley Hamlin | Ruby Nixon | Katja Ince | Emma Zhong |
| Jake Braybrook | Connor Brooks | Peter Clarke | Haidar Alsalih |