Sea levels reflect the state of the climate system. Sea levels change through the addition or removal of mass and through changes in volume. Mass change reflects the exchange between water stored on land in glaciers, ice sheets, dams and ground water and the ocean. Volume change reflects the expansion or contraction of the sea water as it warms or cools.
The starting point for modelling future climates is a set of assumptions about future anthropogenic greenhouse gas (GHG) and aerosol emissions. These are linked to socioeconomic pathways because factors such as population growth, future energy generation and globalisation ultimately determine the amount of greenhouse gases and aerosols will be emitted by society.
Prior to the IPCC Fifth Assessment Report (e.g. IPCC AR4), the development of emission scenarios started with socioeconomic scenarios, which provided the basic assumptions about greenhouse gas and aerosol emissions into the atmosphere. From these assumed emissions, concentrations of GHG and aerosols in the atmosphere were estimated using simple climate models that accounted for some of the emissions being absorbed by the oceans and biosphere, and these were subsequently applied to climate models to simulate climate change. These emission scenarios were based on the Special Report on Emission Scenarios (SRES; Nakicenovic and Swart, 2000).
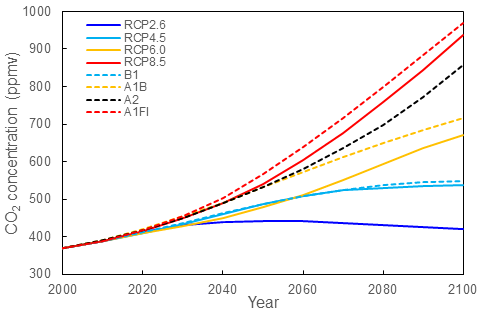
For the IPCC Fifth Assessment Report (IPCC AR5), a new set of future greenhouse gas pathways were developed. To shorten the development time, the process commenced with greenhouse gas Representative Concentration Pathways (RCPs) that could be simultaneously used in climate models to explore future changes in the climate system while at the same time being used in Integrated Assessment Models (IAMs) to explore the different socio-economic conditions that would lead to such future atmospheric composition changes (Van Vuuren et al, 2011). The figure below compares the key SRES (CMIP3/AR4) and RCPs (CMIP5/AR5) that are typically used by modelling groups to simulate possible future climate emissions in terms of atmospheric concentrations of CO2 in parts per million by volume, while the table summarises the warming ranges projected by climate models under the different scenarios.
A comparison of RCPs and SRES CO2 concentrations. Note that these are CO2-only and do not include the ‘CO2-equivalent’ concentrations. (Data is available at http://www.pik-potsdam.de/~mmalte/rcps/). (Note that these curves are for CO2 concentrations not CO2-equivalent concentrations, so will be smaller than the values indicated in columns 2 and 5 of the Table below)
AR4
Scenario
Atmospheric CO2 equivalent in 2100
(ppm)
Temperature Increase
(°C by 2090-2099 relative to 1980-1999)
AR5
Scenario
Atmospheric CO2 equivalent in 2100
(ppm)
Temperature Increase
(°C by 2081-2100 relative to 1986-2005)
A1FI
1550
4.0 (2.4 – 6.4)
RCP 8.5
>1370
3.7 (2.6 – 4.8)
A2
1250
3.4 (2.0 – 5.4)
RCP 6.0
850
2.2 (1.4 – 3.1)
A1B
850
2.8 (1.7 – 4.4)
RCP 4.5
650
1.8 (1.1 – 2.6)
B1
600
1.8 (1.1 – 2.9)
RCP 2.6
490
1.0 (0.3 – 1.7)
The range of atmospheric temperature change predicted by climate models in response to the scenario used in the IPCC AR4 and AR5 assessment reports. The atmosphere has already warmed approximately 1°C since pre-industrial times. (Note that CO2 equivalent concentrations include CO2 concentrations together with the warming potential of other greenhouse gases that have been converted into a CO2 equivalent concentration).
In terms of the RCPs, the RCP8.5 is often considered a ‘business-as-usual’ scenario representing what climate change will be like if society continues to emit greenhouse gas emissions at its current rate. The RCP2.6 scenario more closely represents a climate if temperatures were limited to around 2°C global-averaged warming. Since the Paris Agreement signed in 2015 seeks to limit global warming to not more than 2°C, RCP2.6 is often used to approximate what a 2°C-warmed world will look like.
Sea level budget
Over recent decades, improved observations of the different contributing factors have enabled an approximate closure of the global mean sea level budget, i.e. the sum of the individual components sums to the measured sea level increase. Additionally, improved models represent the observed changes, providing confidence in methods for projecting future sea level change from the various contributing factors.
Global sea level projections
In the IPCC Fifth Assessment Report, global sea level projections are developed for four Representative Concentration Pathways (RCPs) described above.
The IPCC projections of sea level include estimates of contributions from:
Ocean thermal expansion
Glacier mass loss
Greenland and Antarctic ice sheet surface mass balance (net change from the addition of mass through precipitation and loss through melting) and dynamic processes such as collapse of ice shelves
Changes in land water storage (dams and ground water storage)
Sea levels are not uniform but influenced by various factors including large scale weather patterns and ocean currents, which are represented by the CMIP5 climate models. The melting of the large ice sheets of Greenland and Antarctica cause changes in the Earth’s gravitational field and lead to spatial patterns of sea level rise across the global oceans known as ‘finger prints’. Sea-level rise is larger in the oceans farthest from the ice sheets and smaller immediately adjacent to the ice sheets. Long term movements in the Earth’s crust since the last glacial maximum, referred to as Glacial Isostatic Adjustment (GIA) also leads to differences in relative sea level rise. The IPCC (Church et al, 2013) estimates that while spatial variations in the rates of rise exist, 70% of the global coastlines will experience sea-level rise within ±20% of the global mean sea-level rise (MSLR).
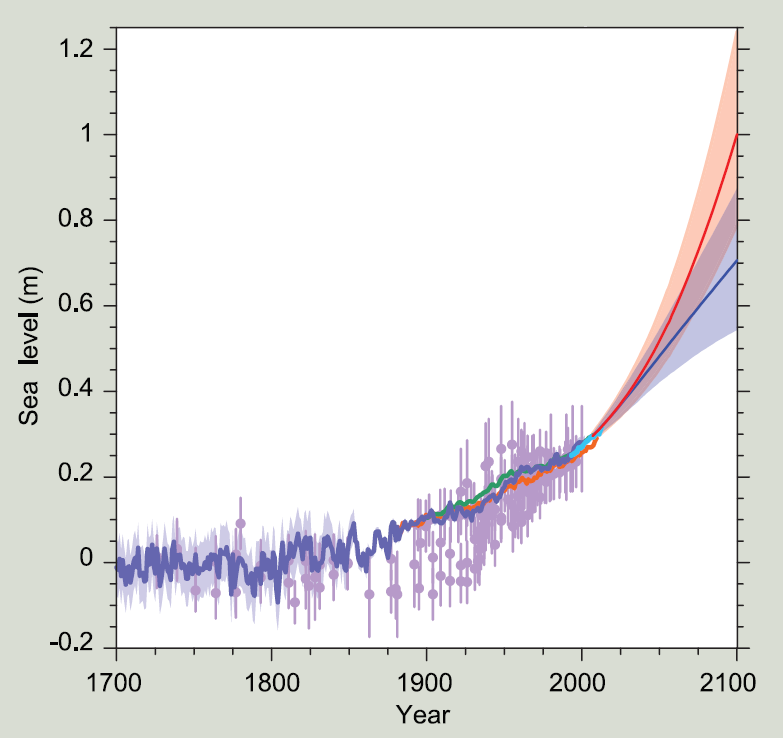
Compilation of paleo sea level data (purple), tide gauge data (blue, red and green), altimeter data (light blue), and central estimates and likely range for projections of global mean sea level rise from the combination of CMIP5 and process-based models for RCP2.6 (blue) and RCP8.5 (red) scenarios, all relative to pre-industrial values. (Source: IPCC (2013) Technical Summary)
Sea level projections for Australia
Sea level projections for Australia have been updated following the method of the IPCC (McInnes et al, 2015).
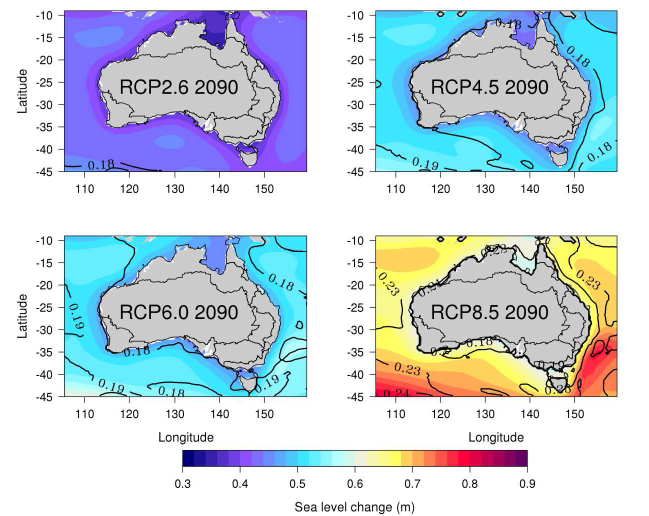
The regional distributions of sea level change (four emissions scenarios) for the period centred on 2090 compared to 1986-2005. The projections (shadings) and uncertainties (solid lines) represent the contributions from the changes in terrestrial ice, the gravitational response of the ocean to these changes, and an ongoing GIA.
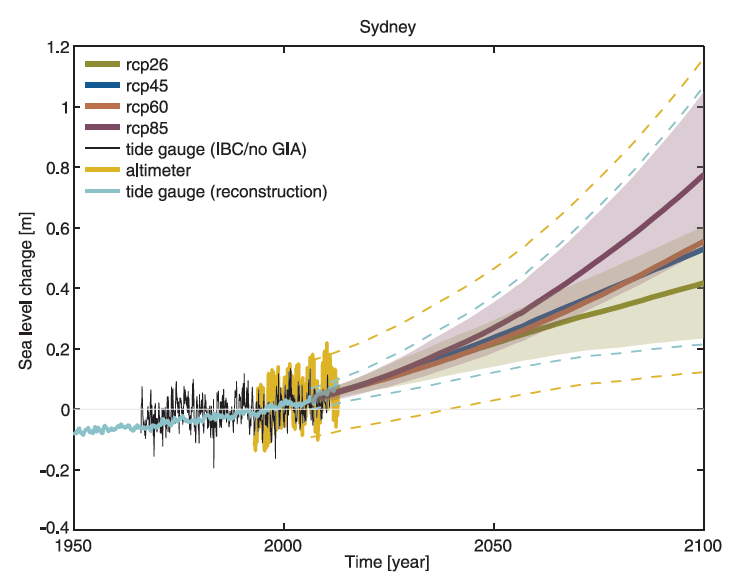
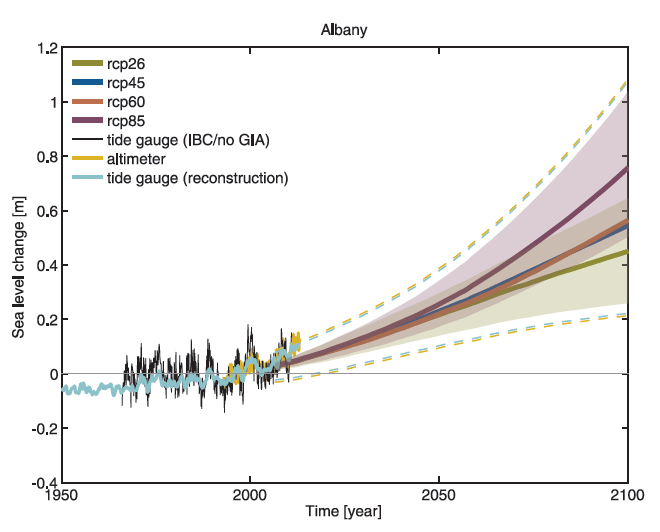
Sea level projections are also available showing observed changes in tide gauges and satellite altimetry. The large year-to-year variability occurs as a result of natural climate variability due to El Nino/Southern Oscillation (ENSO) to show that in the future sea levels may be above or below the average projected increase for the location depending on the background variability.
Sea level observed and projected for Sydney (left) and Albany (right). The observed sea level records are indicated in black, with the satellite record (since 1993) in mustard and tide gauge reconstruction (which has lower variability) in cyan. Multi-model mean projections (thick purple and olive lines) for the RCP8.5 and RCP2.6 emissions scenarios with likely model ranges are shown by the purple and olive shaded regions from 2006 to 2100. The olive dashed lines represent estimates of interannual variability combined with the range of the projections. Thick dark blue and orange lines represent multi-model mean projections for the RCP 4.5 and 6.0 scenarios, respectively.
For the next few decades, the rate of sea-level rise is partly locked in by past emissions, and will not be strongly dependent on early 21st century greenhouse gas emissions. However, sea level projections closer to and beyond 2100 are critically dependent on future greenhouse gas emissions, with both ocean thermal expansion and the ice sheets potentially contributing metres of sea-level rise over centuries for higher greenhouse gas emissions.