Past sea level changes
Historical Sea Level Changes
Long term
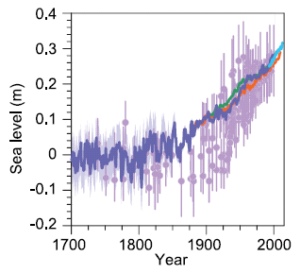
Sea levels reflect the state of the climate system. During ice ages a large volume of water is stored on land in the form of ice sheets and glaciers, leading to lower sea levels, while during warm interglacial periods, glaciers and icesheets are reduced and more water is stored in the oceans. The following provides a summary of changes in global mean sea levels:
- Sea levels typically vary by over 100 metres during glacial-interglacial cycles as the major ice sheets wax and wane as a result of changes in summer solar radiation in high northern hemisphere latitudes.
- Sea level has increased by more than 120 metres since the end of the last ice age.
- Sea level stabilised over the last few thousand years, and there was little change between about 1AD and 1800AD
- Sea level began to rise again in the 19th century and accelerated again in the early 20th century
- Satellite altimeter measurements show a rate of sea-level rise of about 3 mm/year since the early 1990s – indicating a further increase in the rate of rise.
Last few hundred years
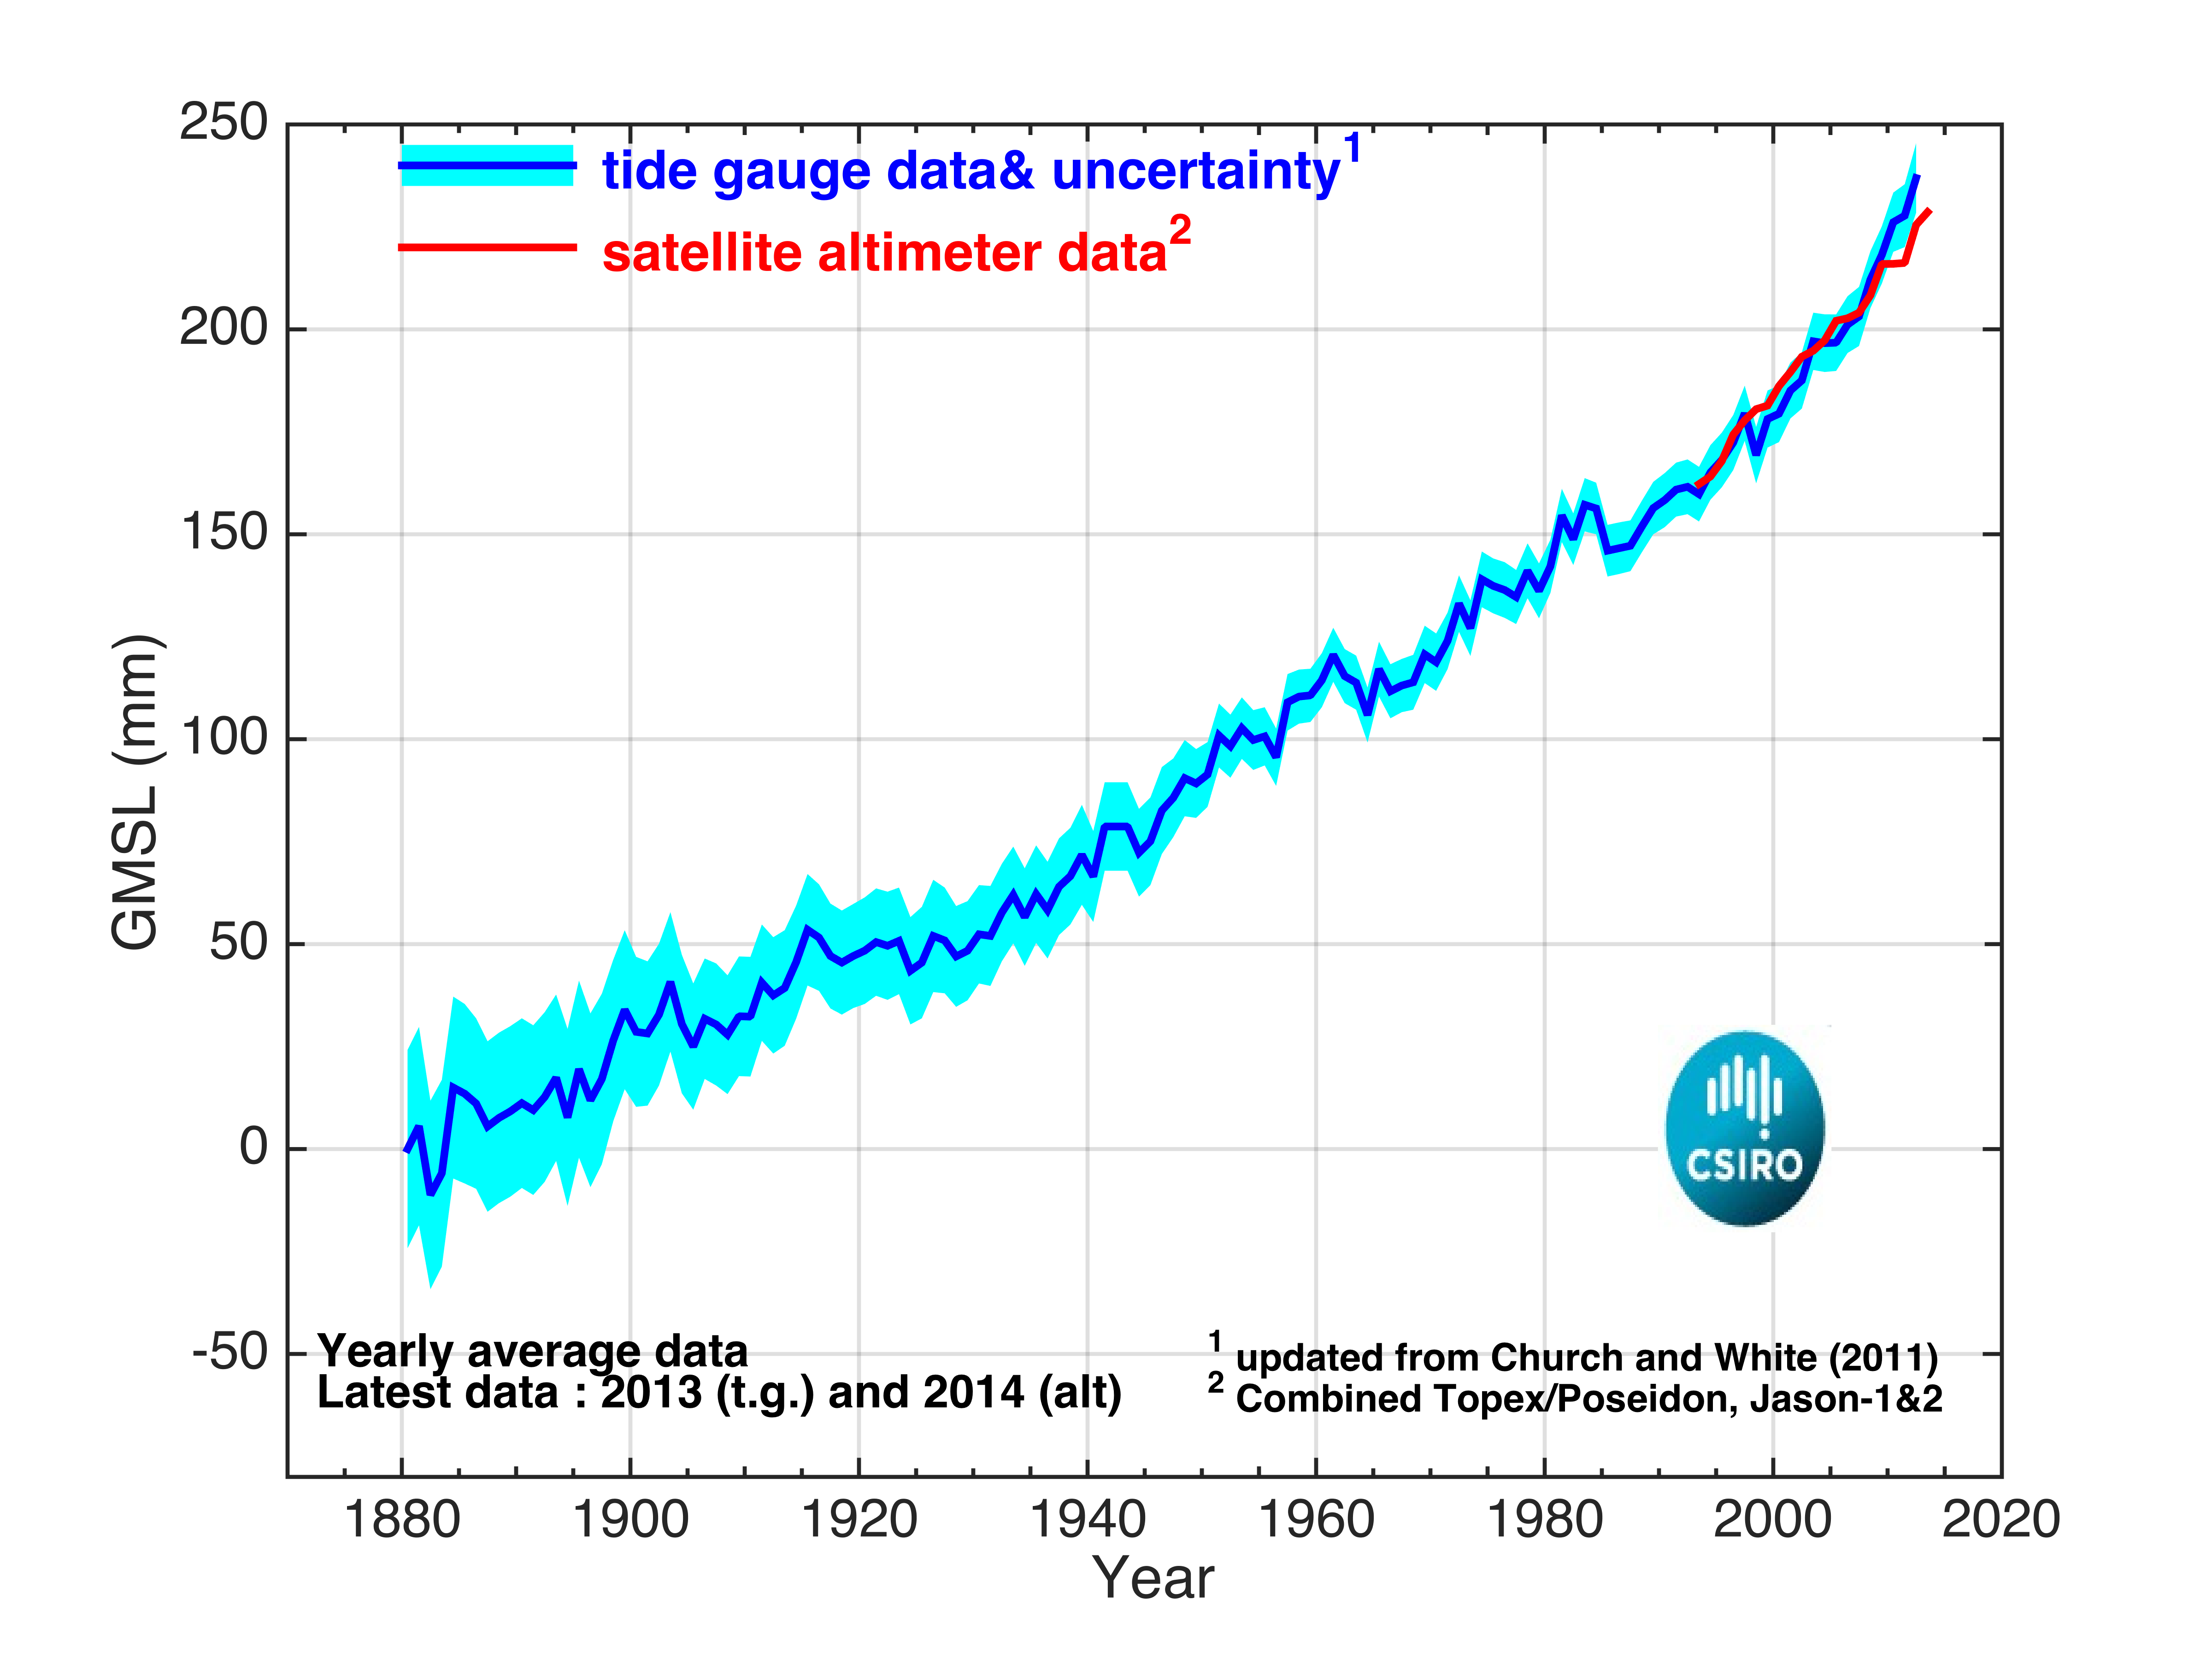
Global Mean Sea Level (GMSL) – 1880 to the end of 2014

Last decades
High quality measurements of (near)-global sea level have been made since late 1992 by satellite altimeters, in particular, TOPEX/Poseidon (launched August, 1992), Jason-1 (launched December, 2001) and Jason-2 (launched June, 2008). This data has shown a more-or-less steady increase in Global Mean Sea Level (GMSL) of around 3.2 ± 0.4 mm/year over that period. This is more than 50% larger than the average value over the 20th century. Whether or not this represents a further increase in the rate of sea level rise is not yet certain.
The two plots below show the GMSL measured from TOPEX/Poseidon, Jason-1 and Jason-2 and soon Jason-3.
This one shows it with the seasonal signal removed: (get the data).
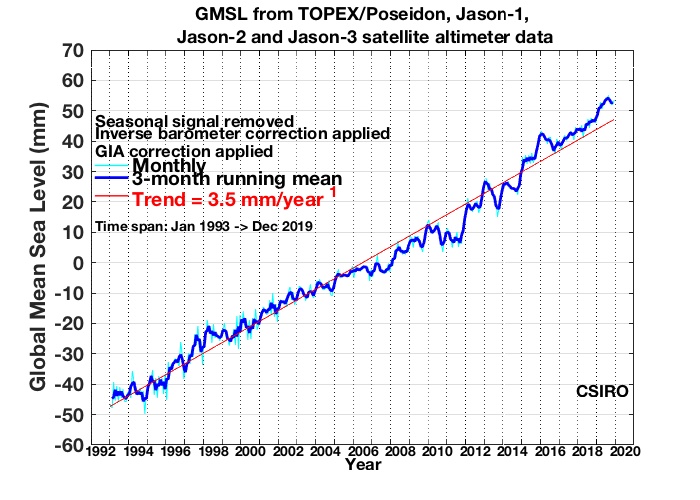 Note: In 2015 we completed a reassessment of the satellite altimeter record of global mean sea level rise (http://dx.doi.org/10.1038/nclimate2635). A plot of the refined record is available [here].
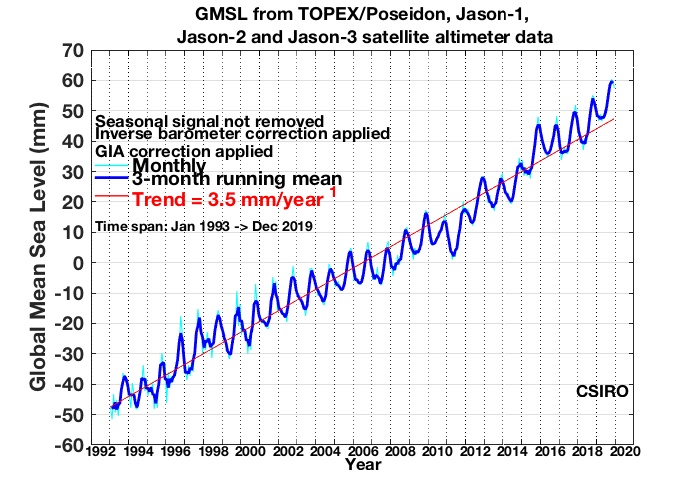
And this shows it with the seasonal signal left in: (get the data)

Sea level and El Niño

There are a number of changes of slope over short periods in the GMSL record. This variability is at least partly related to El Niño and La Niña (sea level rises during El Niño and falls during La Niña) and associated changes in the hydrological cycle.
The above graph shows detrended GMSL (from the top graph) versus the Southern Oscillation (SOI) index, which is one of the common indices of the El Niño/La Niña cycle.
Clearly sea level is higher during an El Niño event (SOI -ve) (see for example the years 1997/1998) and lower during La Niña (SOI +ve) (for example, years 2010/2011).
SOI data is from the Australian Bureau of Meteorology. Data and graphs can be viewed and downloaded from the Bureau of Meterology’s web site.
Regional trends
Sea level does not rise (or fall) uniformly over the oceans. This is illustrated by the map (below) showing sea-level trends from 1993 to 2017. There is a clear pattern of sea-level change that is also reflected in patterns of ocean heat storage.

This pattern reflects interannual climate variability associated with the El Niño/La Niña cycle and the Indian Ocean Dipole, but also longer term changes such as the increase in sea levels in the Western Tropical Pacific due to changes in the Trade Winds. During El Niño years sea level rises in the eastern Pacific and falls in the western Pacific, whereas in La Niña years the opposite is true.

Movie of sea-level changes
(~3MB animated gif) over the last 25 years – this version has had the seasonal (annual+semi-annual) signal removed at each point. This is comparable to the top figure (above).
Click on the map below to see a movie of monthly-mean sea-surface height from January 1993 to December 2015 with the seasonal signal removed. The plot at the top of the page shows the time series of the means of these fields.
The data that is displayed here can be downloaded from the “ Sea Level Data” page on this site.
Note the 1997/98 and the recent 2015 El Niño events!

Another movie of sea-level changes (~3MB animated gif) over the last 25 years
Click on the map below to see a movie of monthly-mean sea-surface height from January 1993 to December 2015. The seasonal signal has not been removed from this, so you should see the pumping as the water in each hemisphere warms and expands in Spring and Summer and cools and shrinks in Autumn and Winter. The second plot (above) shows the time series of the means of these fields.
The data that is displayed here can be downloaded from the “Sea Level Data” page on this site.
Note especially the 1997/98 and the recent 2015 El Niño events!
