Reassessment of estimates of global mean sea level rise
“Reassessment of the satellite altimeter estimates of global mean sea level rise” May 2015.
We have just completed a reassessment of the satellite altimeter record of global mean sea level rise (Watson et al., Nature Climate Change (2015)). We found three important results.
First, we confirm that the rate of sea-level rise has been larger since 1993 compared to the slower rate observed over previous decades.
Second, comparison of the coastal and satellite measurements reveals small differences in the early part of the satellite record from 1993 to 1999. After allowing for land motion at the tide gauges, our revised estimate of global mean sea-level rise for the satellite era (since 1993) is about 2.6±0.4 to 2.9±0.4 mm per year (the exact value depends on how we estimate land motion) – slightly less than the previous estimate of 3.2±0.4 mm per year.
Third, our revised record indicates that the rate of rise has increased over the last 2 decades (independent of how we estimate the vertical land motion), consistent with other observations of the increased contributions of water and ice from Greenland and West Antarctica. The acceleration is also consistent with recent projections, and larger than the twentieth-century acceleration. However, sea level varies from year to year, as water is exchanged between the land and oceans (for example during the Australian floods in 2011), and as a result the observed increase in the rate of rise over the short satellite record is not yet statistically significant.”
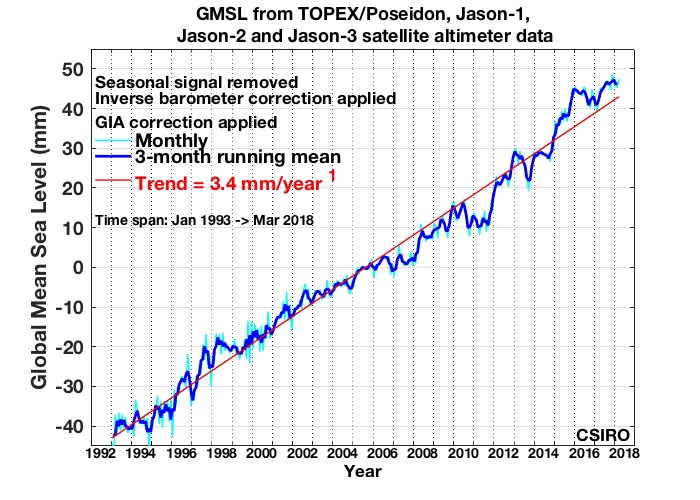
Satellite altimeter global mean sea level time series using the nominal processing is shown by the solid blue line. The brown line shows the version with the satellites biases estimated using a Global Isostatic Adjustment model to estimate the vertical movement of tide gauges. The magenta line shows our refined version where the satellites biases are estimated using accurate GPS vertical movement of tide gauges is used (wherever available – see our paper for details). For each of the 3 versions we superimposed a linear fit (dashed line) and a quadratic fit (solid line). The dataset spans from January 1993 to latest available month of data. Each time series has annual and semi-annual periodic terms removed. The level of the 2 records has been adjusted so that they match during the JASON-2 period when the actual bias is minimal. The revised global mean sea level estimates are available [Here].
While this reassessment of mission specific biases impacts the global mean sea level time series, the spatial pattern in maps of regional sea level trends is unchanged.
This work is part of our long-term satellite altimetry calibration and validation effort supported by the Australian IMOS (Integrated Marine Observing System) [http://imos.org.au/srscalval.html].
Reference :
Watson, C.W., N.J. White, J.A. Church, M.A. King, R.J. Burgette and B. Legresy. (2015). Unabated global mean sea-level rise over the satellite altimeter era. Nature Climate Change. http://dx.doi.org/10.1038/nclimate2635
sea also :
- A commentary on the paper http://theconversation.com/sea-level-is-rising-fast-and-it-seems-to-be-speeding-up
- The altimetry global sea level records description and graphics in the “Historical Last decades” and “Sea level data” sections of the present website.