Sea level changes on a range of temporal and spatial-scales.The total volume of the ocean can change as a result of changes in ocean mass (addition of water to the ocean from the land) or expansion/contraction of the ocean water as it warms/cools.
The ocean is not like a bathtub – that is, the level does not change uniformly as water is added or taken away. There can be large regions of ocean with decreasing sea level even when the overall Global Mean Sea Level (GMSL) is increasing. Obviously there must be regions of ocean with trends correspondingly greater than the mean to balance out the regions with trends less than the mean. There are many processes that drive these changes – we try to give a very brief introduction in these pages.
Processes and factors that can influence global and regional sea level (IPCC AR5)
Some of the processes that drive short term (hours to days) changes in sea level are tides, surface waves, and storm surges, as well as other events like tsunami. For further information, see the Causes of Extreme Sea Level section in the Extremes area.
Seasonal to decadal
Seasonal changes
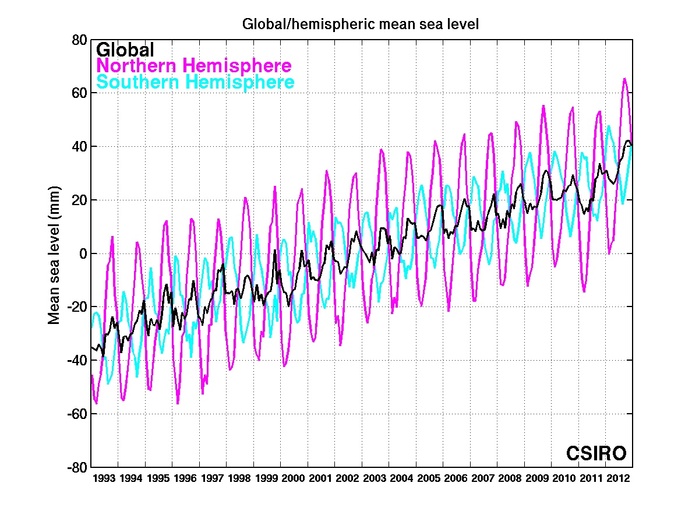
An important cause of intra-annual sea level change is the annual warming/cooling cycle – in each hemisphere the oceans warm and expand in summer, and cool and contract in the winter. Thus the sea levels in each hemisphere are higher in summer and early autumn, and lower in winter and early spring.
In addition there is an increase of water stored on land in the Northern Hemisphere winter and thus less in the ocean, leading to a lower global average sea level at this time of year.
Other changes are related to the latitudinal movement of the weather patterns in the ocean-atmosphere system, which produce changes in ocean currents and thus changes in sea level.
Plot of global- and hemsipheric-mean sea level
Global- and hemispheric-mean sea level from TOPEX/Poseidon and Jason-1. The two hemispheric signals partially cancel to produce a global signal with smaller amplitude.
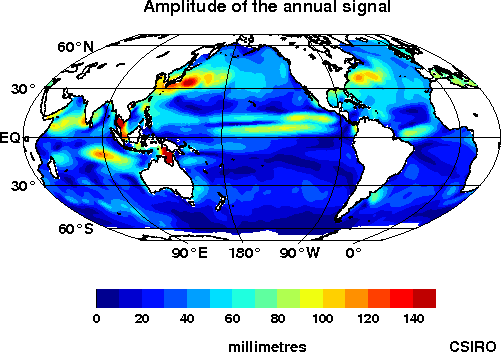
Plot of the amplitude of the annual signal in millimetres
Inter-annual to decadal
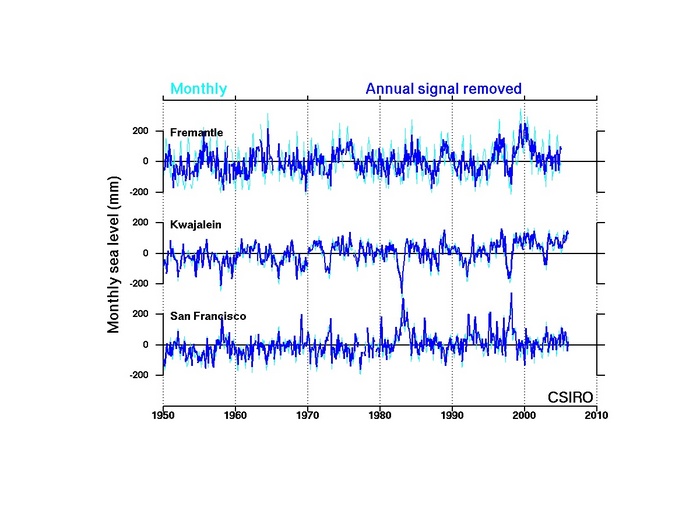
Inter-annual to decadal variability in the ocean-atmosphere system can cause large-scale changes in sea level. For example, El Niño/La Niña events cause coherent positive or negative changes of up to 20-30 cm in sea level from the eastern Pacific Ocean to the eastern Indian Ocean, as shown by the plots of sea level from tide gauges below.
Tide gauge records from Fremantle (SW Australia), Kwajalein Atoll (Western Tropical Pacific) and San Francisco (Eastern Pacific). Monthly data is shown in light blue, and the data with the annual signal removed is shown in dark blue. Note the correlated/anti-correlated signals at time of El Niño events (e.g. 1983 and 1997).
Other decadal changes (e.g. the Pacific Decadal Oscillation and the Indian Ocean Dipole) also cause significant large-scale changes in sea level as does exchange of water with the atmosphere and storage on and in the land.
Longer term
On time scales of months and longer, sea level changes as a result of both changes in ocean mass (addition of water to the ocean from the land) and expansion/contraction of the ocean water as it warms/cools.
Thermal Expansion
Thermal expansion is one of the main contributors to long-term sea level change, as well as being part of regional and short-term changes. Water expands as it warms and contracts as it cools. From 1971-2010 the average contribution from thermal expansion was 0.8 [0.5 to 1.1] mm/yr, and from 1993-2010 it was 1.1 [0.8 to 1.4] mm/yr representing approximately 40% and 34% of the measured global mean rate of sea level rise over these periods (see Church et al., 2013).
Non-polar Glaciers
Non-polar glaciers have also been a major contributor to recent sea level rise. From 1971-2010 melting of these glaciers contributed 0.62 [0.25 to 0.99] mm/yr to sea level rise while over the period 1993-2010 they contributed 0.76 [0.39 to 1.13] mm/yr (see Church el al., 2013).
Greenland and Antarctica
The contributions of Greenland and Antarctica to sea level rise occur mainly as a result of direct melting and flow into the ocean. However, other dynamic processes can contribute and potentially lead to increases in the contribution by these ice sheets to sea level rise. These ‘dynamic processes’ include processes such as collapse of ice shelves into the ocean as the buttressing effects of surrounding sea ice are diminished through ocean warming. Melting of the Greenland ice sheet contributed around 0.33 [0.25 to 0.41] mm/yr to sea level rise over the period 1993-2010 while the Greenland glaciers contributed around 0.10 [0.07 to 0.13] mm/yr to sea level rise over this period. The Antarctic ice sheet contributed around 0.27 [0.16 to 0.38] mm/yr to sea level rise over the period 1993-2010 (see Church et al., 2013).
Mass Exchange
Exchange of water with other “reservoirs” is an important contribution to sea level change. A significant part of this is through the hydrological cycle, where water evaporates from the ocean, resides in the atmosphere, then returns to the ocean either directly as rainfall or via reservoirs (snow, ice, lakes, rivers, groundwater etc). There are both annual variations as well as longer-term variations. For example, extraction of water from underground aquifers can increase the mass of the ocean whereas the storage of water in dams can result in a decrease. The period of rapid dam building during the 1950’s and 1960’s led to a net lowering of sea level as water was impounded on land. Over the period 1901-1990, the contribution from this source to sea level rise was negative, i.e. -0.11 [-0.16 to -0.06] mm/yr. However, the reduction in building new dams in recent times together with the increase in ground water pumping to provide freshwater supplies, which ultimately find their way back to the ocean, means that land water has contributed positively to sea level rise over more recent times, contributing 0.12 [0.03 to 0.22] mm/yr over 1971-2010 and 0.38 [0.26 to 0.49] mm/yr over 1993-2010 (see Church et al, 2013).