Models
The marine modelling component of eReefs was tasked to deliver numerical models capable of simulating and predicting the physical hydrodynamic state, sediment transport, water quality and basal ecology of the Great Barrier Reef lagoon and reef matrix. Together, these models represent a capability to simulate the transport and fate of waterborne material, of either oceanic or terrestrial origin, and its impact on Reef water quality.
The eReefs regional and relocatable models include hydrodynamic, sediment, wave and biogeochemistry models for the Great Barrier Reef ecosystem. Some examples of products available from these model systems are shown below. See Model Outputs for further examples and about the models for more details. The Executive and Technical summaries from the model technical report can be accessed via the following links:
eReefs models Executive Summary (6 pages)
eReefs models Technical summary (5 pages)
Appendix A: eReefs Biogeochemistry configuration and model assessment 47.1 MB
The full model technical report and 2020 reanalysis and associated appendices can also be downloaded at the bottom of the page.
Latest News:
Catchment scenarios
A 45 min seminar describing the eReefs scenarios used for setting catchment nutrient and sediment load targets for the GBR can be found here: Reef Matters Seminar Series: Dr Mark Baird » Australian Coral Reef Society.
R-package for plotting eReefs data.
Barbara Robson has just released an eReefs R-package that you can use to download and plot eReefs data
Mechanistic coral bleaching model.
As part of a NESP TWQ Hub project, we have developed a new coral bleaching model. The behaviour of the model is summarised in a poster (Wozniak_Aqua_Fluo2017). Outputs using RECOM at Davies Reef for 2017 appear in the below animation:
Details: A 200 m resolution eReefs model simulation using RECOM is initialised and forced by eReefs GBR1_H2p0_B2p0_Chyd_Dhnd. Additional processes of coral photophysiology are applied in the RECOM grid.
Satellite – GBR1 comparison in the Whitsundays region (2017).
To determine the trajectory of water quality in a particular region, it is best to combine knowledge from models and observations. Below shows an animation of GBR1_H2p0_B1p9_Cnrt_Dhnd (top row) and satellite-retrieved properties (bottom row), as well as a snapshot from the 2nd May 2017. The satellite-retrievals use atmospherically-corrected MODIS remote-sensing reflectance, and a matrix inversion analysis, to estimate in-water properties.
A number of points can be made:
- The model appears to capture many of the features seen in the satellite-retrieved observations, fitting both magnitude and spatial distributions.
- Clouds significantly impact on the satellite-retrievals, especially around cyclone Debbie when the water clarity is poorest.
- In near-shore regions the water clarity improved after Cyclone Debbie quicker in the model than the observations. This may relate to the use of approximate river loads of nutrients and sediments.
Baseline and Pre-industrial 4 km B2p0 BGC simulation
In 2017, the CSIRO eReefs team released the first GBR4 Biogeochemistry and Sediments model results.
The images below show a comparison between the results of a 6 year run of the B2p0 biogeochemical model with SOURCE Catchments baseline loads (GBR4_H2p0_B2p0_Chyd_Dcrt) and with a run of the same model and length with SOURCE Catchments Pre-Industrial loads (GBR4_H2p0_B2p0_Cpre_Dcrt).

The Chl, DIN and TSS (top, middle, bottom rows) of the Baseline, Pre-Industrial, and Baseline minus Pre- industrial (left, middle and right) of the GBR4_H2p0_B2p0 configuration on the 1 Feb 2011. Note the simulations are identical far offshore, and have the greatest difference downstream of the Burdekin River mouth.
Here is the Matlab script that created the above figure.
The simulations ran from 1 Jan 2011 – 31 Oct 2016, and has achieved improved skill compared to GBR4_H1p85_B1p0_Chyd_Dcrt that was released in January 2016. Comparisons of GBR4_H2p0_B2p0_Chyd_Dcrt against in situ observations is available in two pdfs (gbr4-H2p0-B2p0-Chyd-Dcrt_vs_insitu_PartI; gbr4-H2p0-B2p0-Chyd-Dcrt_vs_insitu_PartII).
Enhancements in GBR4_H2p0_B2p0_Chyd_Dcrt.
- Simulation uses SOURCE Catchments Baseline loads until Nov 2016;
- Added a new deep seagrass species. All seagrass species mortality enhanced by bottom shear stress and seagrass can now take up nutrient through their leaves.
- Benthic microalgae production forced by a spectrally-resolved light field (rather than PAR averaged).
- Carbon chemistry calculations implemented in the sediment porewaters.
- Time-varying atmospheric pCO2 used to force air-sea exchange.
- Distinguish between optical properties of carbonate and non-carbonate sediments (THIS LEADS TO TOTAL SUSPEDNED SOLIDS BEING THE SUM OF FineSed, Mud and CarbSand).
- Improved calculation of simulated satellite products.
- Including VIIRS wavelengths in optical calculations.
- Implemented ecological processes on boundary cells; dynamic porosity in ecological process calculations.
- Calculation of turbidity using the optical model.
The new version was implemented to deliver simulations for two NESP Tropical Water Quality Hub projects, requiring the additional seagrass processes and more sophisticated simulated remote-sensing reflectance calculations. With these and other small changes, GBR4_H2p0_B2p0_Chyd_Dcrt improved the skill in simulating surface chl a concentration at the AIMS MMP sites, reducing RMS error from 0.34 (in GBR4_H1p85_B1p0_Chyd_Dcrt) to 0.29 mg/m3.
Here is a demo Matlab script that downloads and plots variables from the NCI.
Both sets of model results were also made available as boundary forcing in RECOM.
Freshwater, sediment and optical plumes of 2016
In the coupled eReefs model, plumes can be quantified by their impact on hydrodynamics or optics.
The Burdekin River plumes in the eReefs simulation GBR4_H2p0_B1p9_Cfur_Dhnd during 2016, as quantified, clockwise was from top left by, surface salinity, surface Burdekin River dye, ocean colour plume classification, and simulated true colour. Note that the optical plume classifications, while giving an insightful perspective of the properties of overlying waters on the bottom habitats, often classify resuspension zones as river plumes.
Fitzroy River during Tropical Cyclone Debbie (Mar-May 2017). The animation below shows our 4 simulated plumes for the Fitzroy. In the beginning of March the coastal concentrations of Fitzroy River water are low (< 20 %) and only a slight freshwater signal can seen. The Keppel Bay region has generally good water clarity through most of March. On about the 22 March there is a sudden decrease in salinity offshore, associated with the rainfall and mixing generated by TC Debbie. The Fitzroy starts discharging strongly in the first week of April, with the river tracer showing that, while the plume is initially tightly against the coast, it does reach out to the Keppel and North Keppel Islands. The water clarity is also strongly affected by re-suspension to a significant distance offshore, even impacting the Capricorn Bunker reefs. Once the Fitzroy River is discharging strong, a classic plume structure forms, with high suspended material initially generating a brown plume. With distance the particles sink out, leaving a dark green organic matter plume that reaches into Shoalwater Bay and Broadwater Sound. By the middle of May the plume has dramatically decreased, but Fitzroy River water remains in the Shoalwater Bay and Broadwater Sound region.
Simulated true colour
Simulated true colour animation from GBR1: The animation moves northward from the southern end of the GBRMP. Yellow is river sediment, dark green is CDOM and green-blue is phytoplankton.
Simulated true colour animation from the Whitsundays region: Yellow is river sediment, dark green is CDOM and green-blue is phytoplankton.
Simulated true colour animation from the Broad Sound region: Yellow is river sediment, dark green is CDOM and green-blue is phytoplankton.
The 2016 Coral Bleaching Event captured by the eReefs modelling suite
During the summer of 2015/16, the Great Barrier Reef suffered its worst bleaching event in recorded history. The eReefs modelling suite quantified the thermal stress on the corals reefs with unprecedented temporal and spatial resolution.
The first figure represents a snapshot of the bleaching event and the following animation represents the lead up to the event
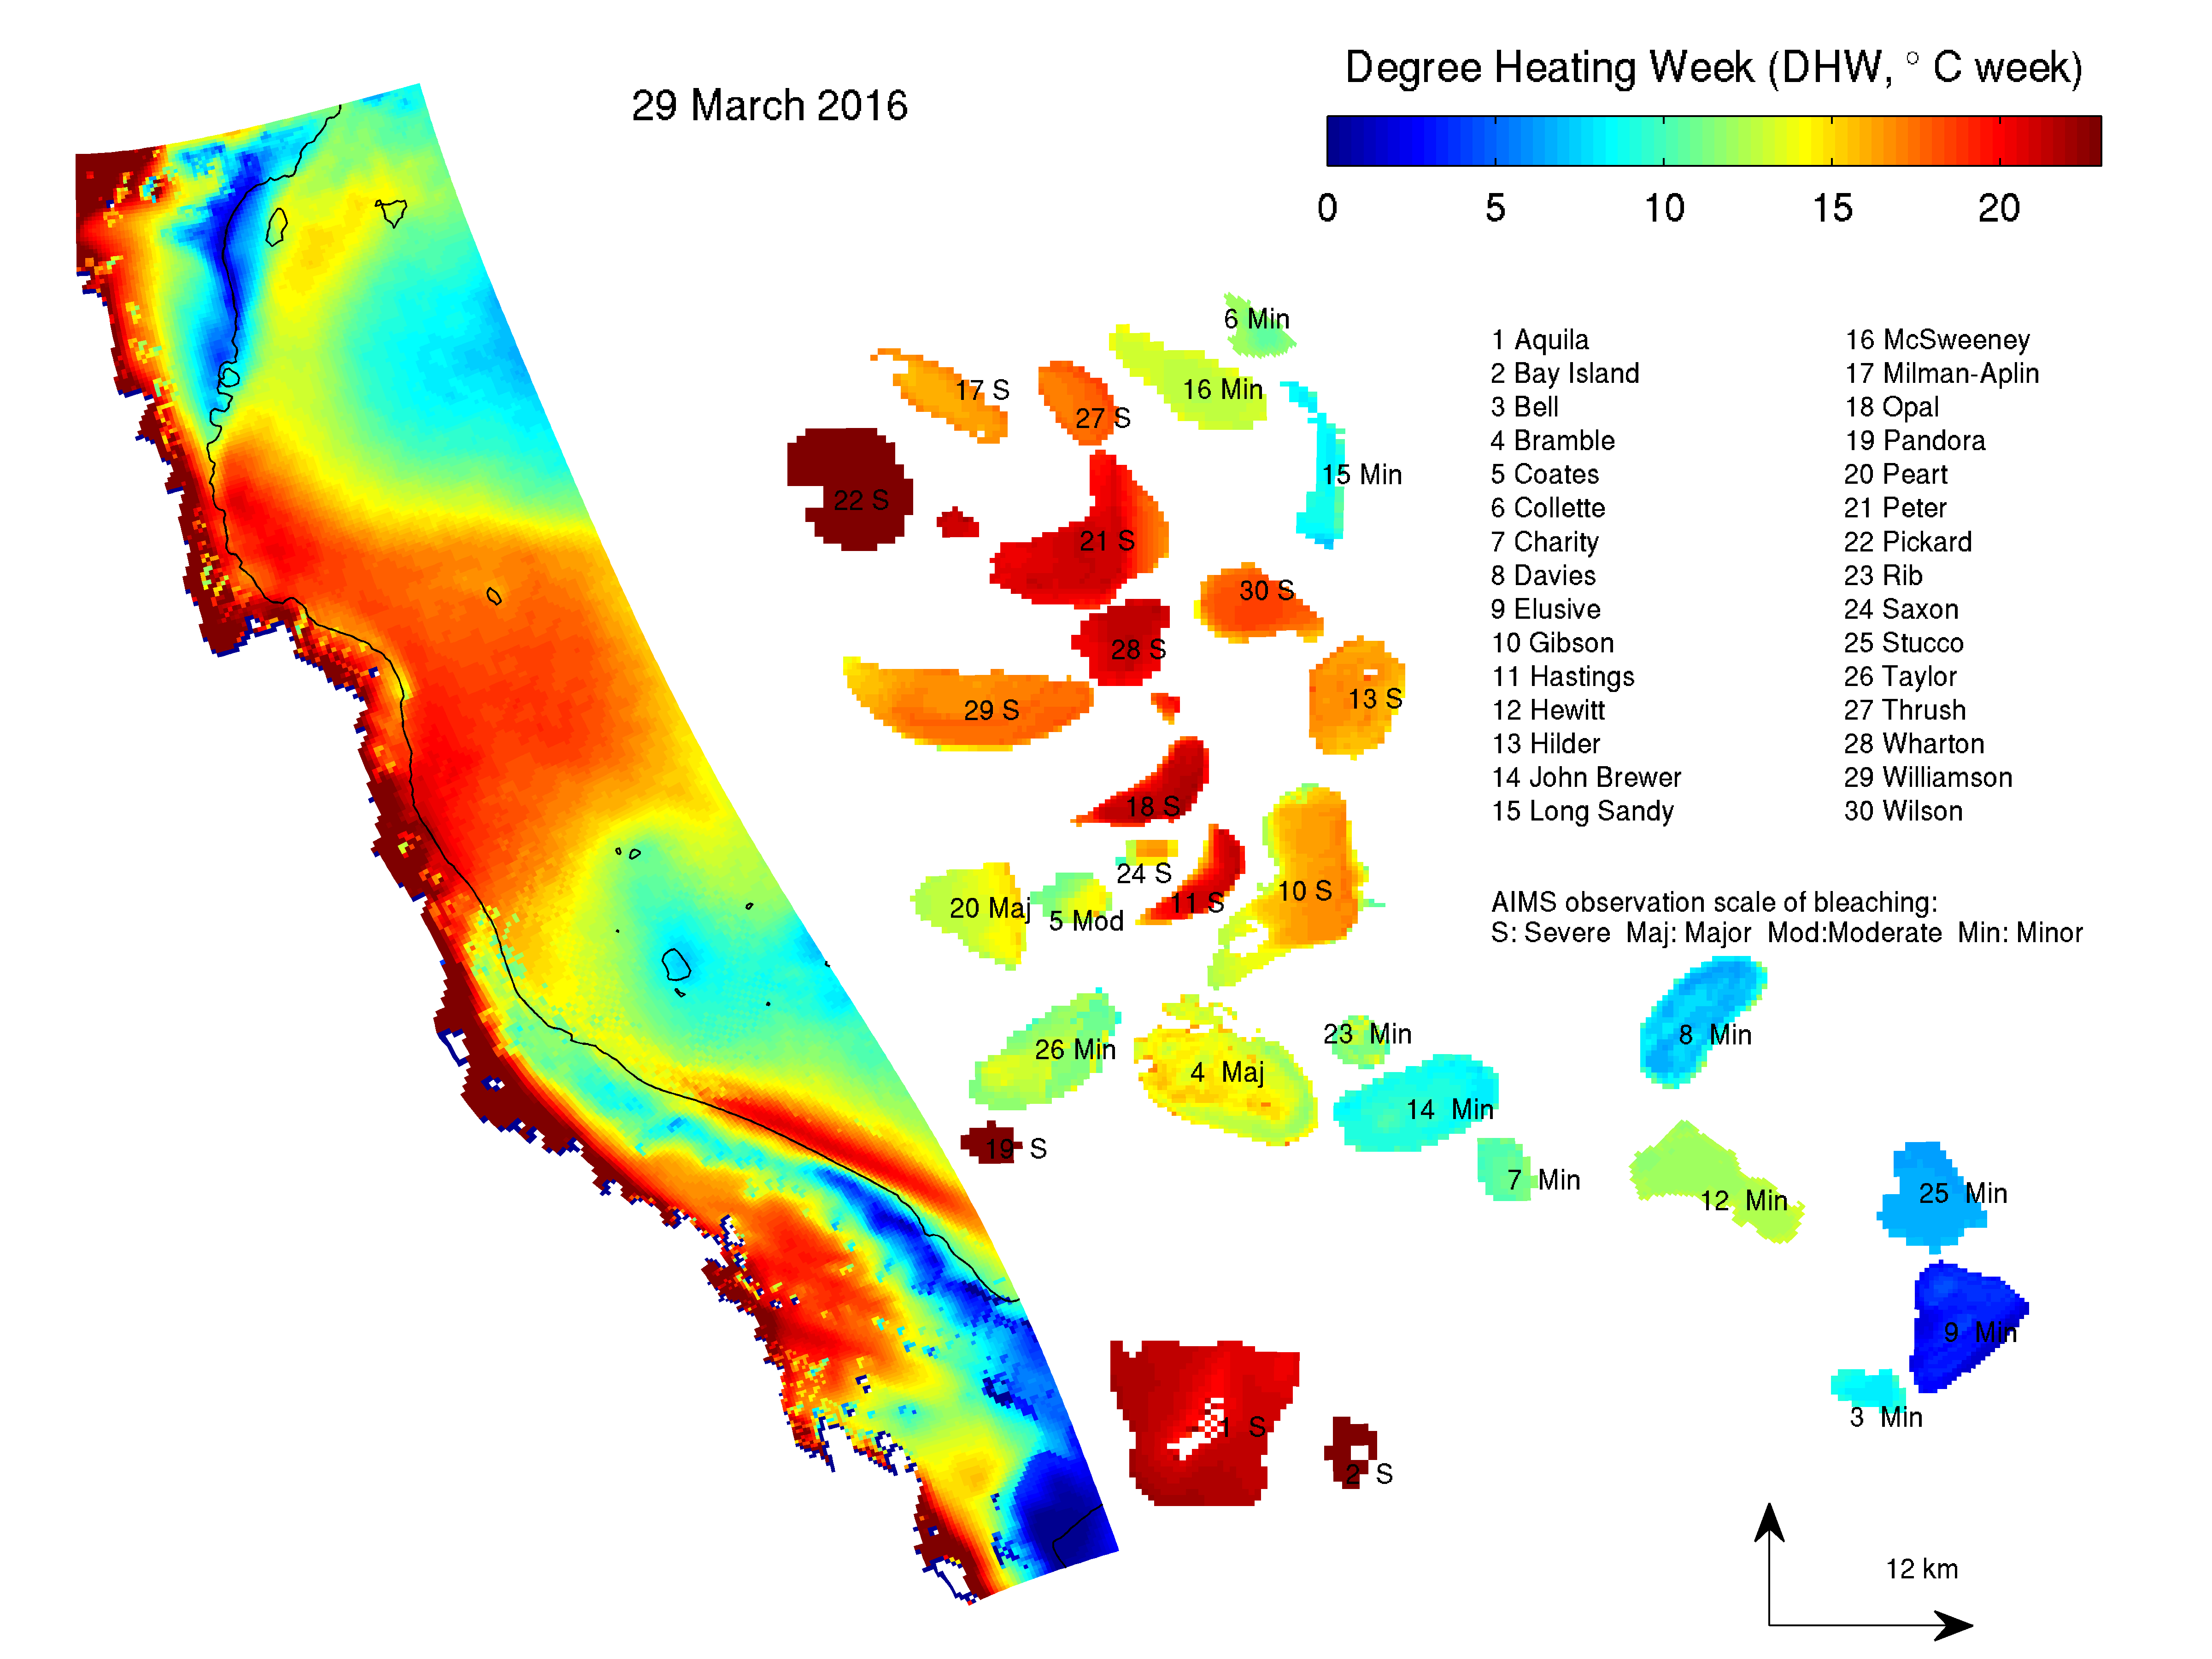
Thermal stress on corals from 1 Dec 2015 – 31 March 2016 as quantified by Degree Heat Weeks (DHWs) by the 4 km resolution GBR-wide model (GBR4, left hand side) and at each of the 30 individually-resolved ~200 m resolution Relocatable Ocean Models (RECOM, right hand side). Degree Heating Weeks is the cumulative sum of the degrees above the seasonal mean multiplied by the duration of weeks. Thus 1 degree above the seasonal mean for 2 weeks gives DHW = 2 C week. On GBR4 the DHW is an average of the top 17 m of water; for the individual reefs it is calculated at the seabed. The individual reefs are magnified ~200 times, and are aligned vertically by their latitude with the GBR-wide model on the left, and horizontally by their distance from the coast.
The animation shows the GBR-wide trend in thermal stress with the warmest waters in the north and closest to the coast. These GBR-wide trends are seen across the individual reefs, with processes such as tidal currents, wind-driven vertical mixing, local circulation, and lagoon heating and cooling adding further spatial variability.
The simulations finish on 31 March 2016 at approximately the maximum cumulative thermal stress across the individual reefs over summer, a strong indicator of both coral bleaching and bleaching mortality. One observational metric use to quantify the severity of bleaching of particular reef is the percent area bleached. The greater the percentage of the reef bleached, the less resilient this individual reef is to bleaching. By producing high-resolution spatial maps of individual reefs, the model quantifies the percent area of a reef over a DHW threshold of 14 C week that is known to lead to high mortality. We are presently working with our colleagues at AIMS to compare the model-generated DHWs in the above figure with the observed severity of bleaching from the 2016 event. The labels S, Maj, Mod and Min give the AIMS assessments of the reefs at the send of the summer.
The present suite of high-resolution models of individual reefs provides the best opportunity to quantify the relative vulnerability of hundreds of unobserved reefs to the climatic conditions of 2016. Further simulations, run for past summers, and for predictions of future climatic conditions, can be used to quantify the resilience of individual reefs for the envelope of future conditions that the GBR is likely to face.
RECOM Coral bleaching event team: Mark Baird, Elisa Elofer, Marion Mengin, Mike Herzfeld, Farhan Rizwi
What we’ve produced
The raw eReefs model data is available through this website (Access to raw model output) or via THREDDS server: Access to raw model outputs via THREDDS server on NCI
The RElocatable Coastal Ocean Model (RECOM) developed under eReefs is functional and can be demonstrated in a CSIRO development computing environment. After consultation with stakeholders, a deployment strategy will be implemented after which RECOM will be publically accessible.
Currently, there have been 21 eReefs related papers published in peer-reviewed journals, and eReefs material has been presented at 27 international and national conferences, workshops and seminars. Since there remains a wealth of information residing in the eReefs archive yet to be explored, this list will undoubtedly grow. Many of these publications relate to state-of-the-art development that occurred during the eReefs project, and this development is a significant achievement in its own right. These enhancements notably include advances in data assimilation, open boundary conditions, transport models, optical models, carbon chemistry and inclusion of the impacts of Trichodesmium on nutrient budgets. These developments are transportable to other applications. RECOM was associated with significant development, and currently lies at the forefront of automated relocatable modelling systems; to our knowledge it is the only model of its kind capable of simulating hydrodynamics through to biogeochemistry with its advanced level of automation.
Operational considerations
The eReefs marine models are suitable for, and currently performing in, near real-time operation. The infrastructure that supports the near real-time operation has now been functioning for multiple years and is considered robust. There is a commitment by CSIRO to continue to operate these models on an on-going basis, and provide outputs to the wider community at various levels ranging from snapshots and animations of key variables, value added products based on these key variables, web enabled exploration of the raw data and access to the raw data itself. Many of these model-based products and data access and integration tools are being developed through other eReefs projects. The on-going operation of the modelling suite and provision of data products will require resourcing, and the level of resourcing will be dependent on the uptake and demand for eReefs products. Currently the commitment is to make the eReefs outputs available and rectify any downtime in a reasonable timeframe within business hours (Mon-Fri, 9-5). Reasonable user requests will be facilitated along similar lines.
The full model technical report and associated appendices can be downloaded here
eReefs model Technical Report
Download (32.3 MB)
Appendix A: eReefs Biogeochemistry configuration and model assessment
Download (47.1 MB)
ATechnical assessment of BGC model version [GBR4_H2p0_B3p1_Chyd_Dhnd], updated August 2020
Download (29.0 MB)
The Biogeochemical Scientific Description is under open review at Geoscientific Model Development. Earlier versions of the manual can be requested by emailing mark.baird@csiro.au.
Marine model methods summary
Summary Document