Applications
While there may in some cases be more research needed, there is an enormous variety of potential applications that NovaSAR-1 data can be used for. These include:
|
|
Below we look at some of these in more detail:
Maritime
NovaSAR-1 can be used for a number of maritime applications including ship detection, oil bunkering, oil spill monitoring and sea ice monitoring.
Ship Detection
NovaSAR-1 is equipped with a 400km wide swath for ship detection across oceans. Combining SAR and AIS data will provide additional information for shipping, fishing and customs authorities. Ship wake detection can be used to determine speed and direction.
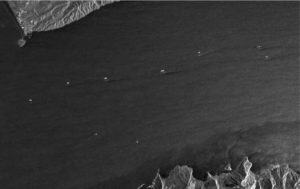
Ship and wake detection in the Strait of Gibraltar, TerraSAR-X. Source: Astrium Services / Infoterra GmbH.
Oil Spill Monitoring
Oil slicks are easily detected in SAR images as they appear darker than oil-free areas due to dampening of capillary waves.
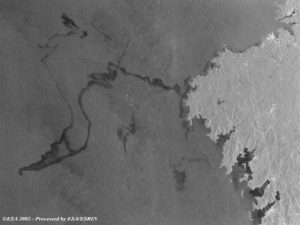
An Envisat ASAR image acquisition over the Prestige Oil Spill in Galicia, Spain. The image covers an area of 400x300km. Source: ESA
Sea Ice Monitoring
SAR images provide critical support for navigation of sea ice in oil and gas exploration. The capability is of particular use at the polar latitudes, where there are long periods of darkness during the winter months.
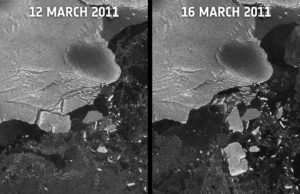
Images captured by Envisat’s ASAR over the Sulzberger Ice Shelf, Antartica. The newly formed icebergs can clearly be seen in the second image. Source: ESA
Disaster Monitoring
NovaSAR-1 will provide response imagery to support disaster relief planning and management, as well as conducting specific damage assessments post-disaster. It can be used to map the impact of a range of disasters including floods, earthquakes, landslides, volcanic eruptions, cyclones/hurricanes/typhoons, tsunamis, and fires. Data can be used to map the extent of the disaster, relief pathways and infrastructure; and for building damage assessments.
Flood Monitoring
SAR is particularly applicable to flood management due to its ability to image through clouds and precipitation in an active flood event. Flooded areas are easily detected by S-band SAR imagery and can be highlighted using change detection techniques. S-band penetrates through cloud and rain significantly better than higher frequencies and hence will provide a more reliable source of imagery in high rainfall areas.
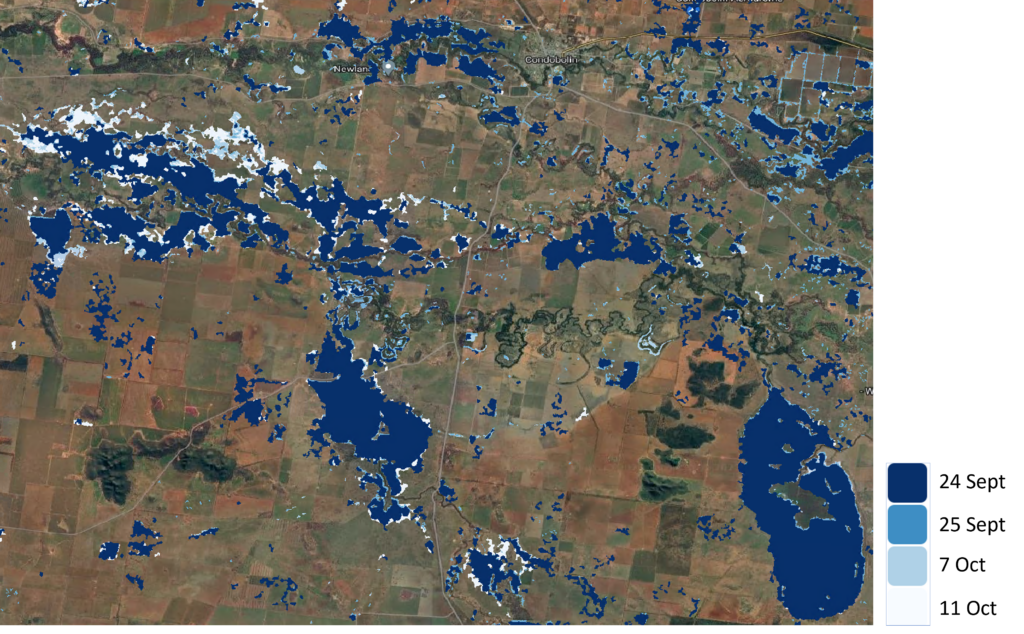
Sentinel-1 and NovaSAR-1 flood maps for the Lachlan Valley studysite. Different colours represent a different date. The flood maps are overlaidon a Google Maps background.
Agriculture
NovaSAR-1 supports agricultural applications including classification of crop type, mapping agricultural land, assessing crop condition, growth and moisture content. Multi-polarised images are particularly useful at distinguishing different crop types. For singularly polarised imagery, multi-temporal information is important particularly when distinguishing different crop types, as different crops will exhibit different characteristics throughout the growing season.
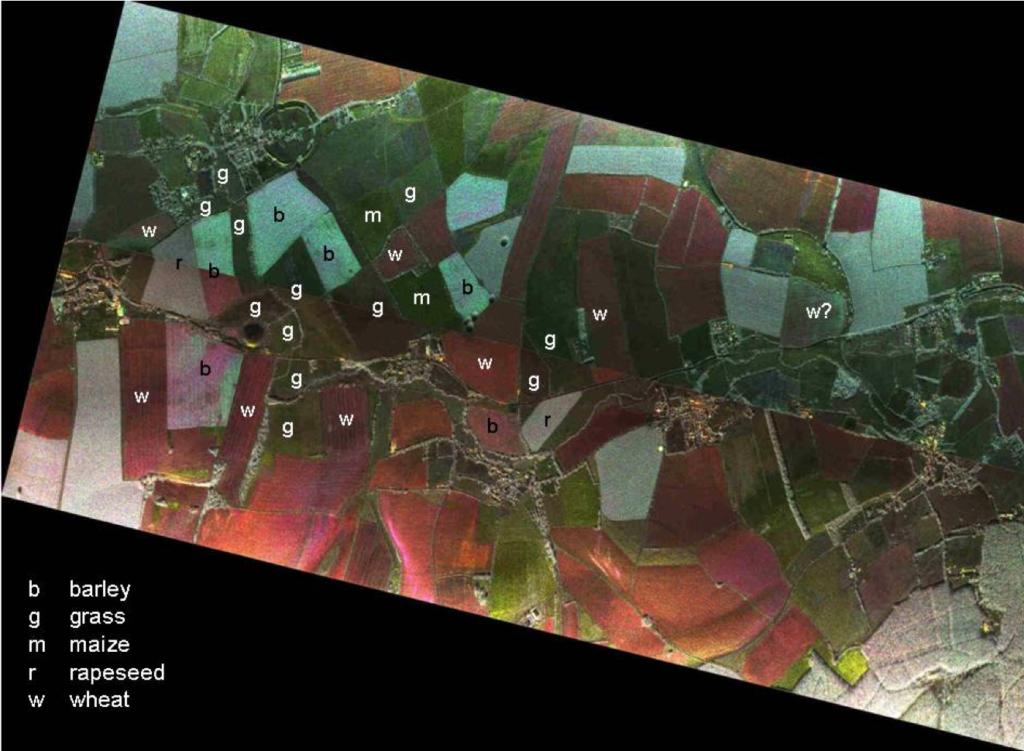
Multi-polarised image from Airborne trials of the NovaSAR-1 imager with crop classifications (Green VV, Red HH, Blue HV). Source: SSTL
Multi-polarised image from Airbus UK airborne SAR demonstrator trials of the NovaSAR-1 imager with crop classifications (Green: VV, Red: HH, Blue: HV). Source: SSTL
Land Classification
Radar data can distinguish differences in surface roughness, moisture content and geometry of different land surfaces, and hence can be used to identify, and delineate between different land cover and land-use types.
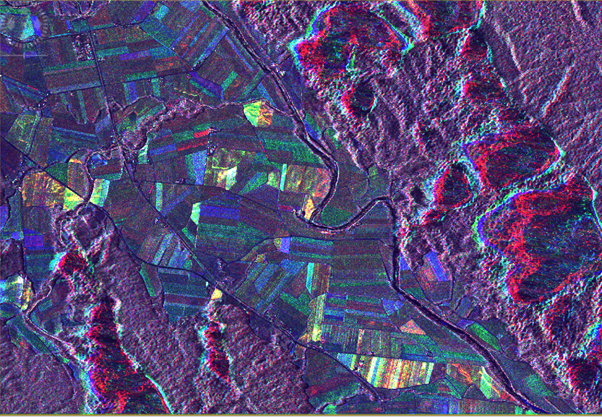
This image shows a multi-temporal HH NovaSAR-1 image of a region of sugarcane in Far North Queensland, where red is from 12th October 2019, green is from 6th February 2020 and blue is from 16th May 2020. The different characteristics of the sugarcane blocks show as different colours in this high-resolution image (spatial resolution is 6m x 6m from Stripmap mode).
Sugarcane in Far North Queensland
Forestry
SAR can assist with forest mapping and inventories, as well as the detection of disturbances caused by logging, forest fires, insect attacks, etc. It is particularly useful for forest monitoring where persistent cloud cover prevents the use of optical imagery (e.g. tropical rainforest). S-band SAR has been shown to have some ability to penetrate the forest canopy to distinguish between forested and non-forested areas and to separate forest types.
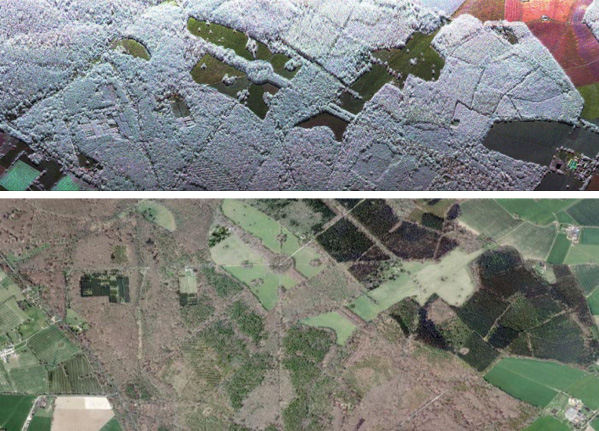
S-band multi-polarised image and Google Earth image of Savernake Forest, Wiltshire, UK. The forest is clearly distinguishable from the other land-use types in the S-band image due to its texture. Source: SSTL
S-band multi-polarised image and Google Earth image of Savernake Forest, Wiltshire, UK. The forest is clearly distinguishable from the other land-use types in the S-band image due to its texture. Source: SSTL.