Preliminary catchment scenarios outputs
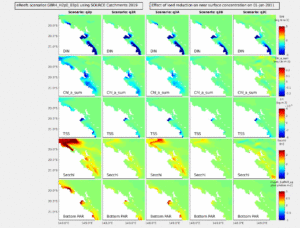
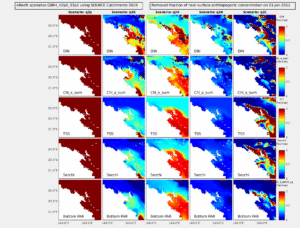
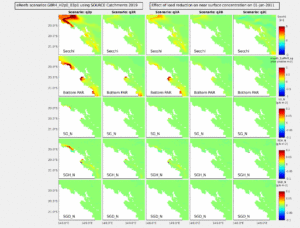
Below are preliminary results from the eReefs simulations of the best estimate of 2011-2019, and the 5 catchment repair scenarios (described here). The simulations were completed around September 2019. Results below show 2011.
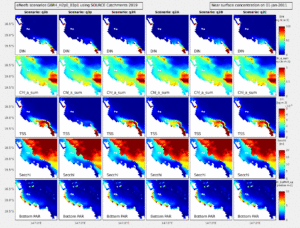
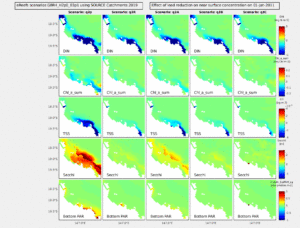
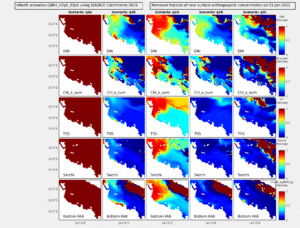
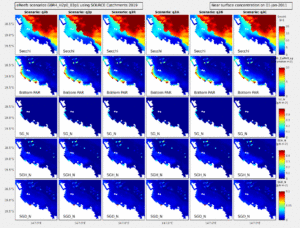
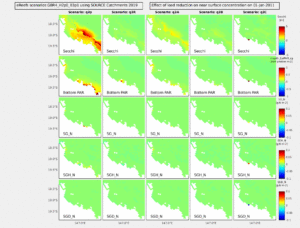
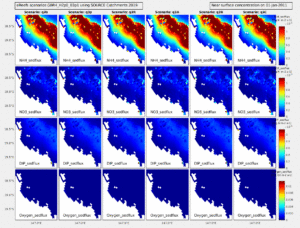
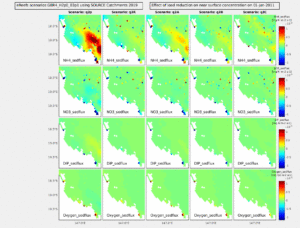
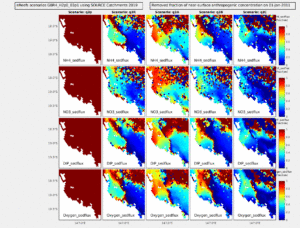
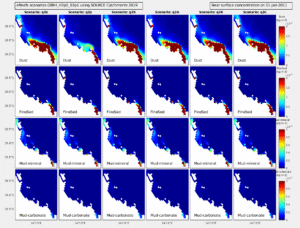
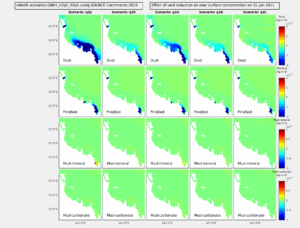
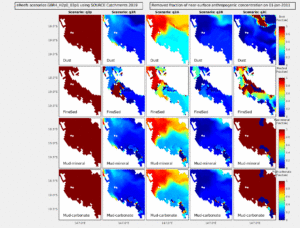
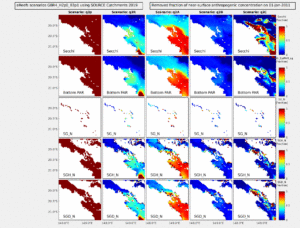
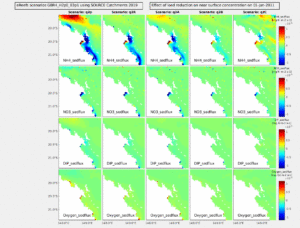
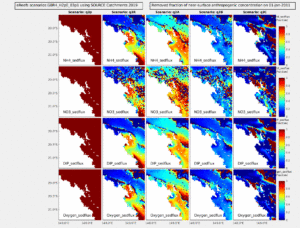
Click on the images in the Tables below to get the animation going. The columns show the state (left column) in all 6 scenarios (q3b, q3p, q3R, q3A, q3B, q3C), the difference (2nd column) between the baseline (q3b) and each reduced load scenario (q3p, q3R, q3A, q3B, q3C), and the fraction (3rd column) of anthropogenic change (q3b-q3p) that is offset by the four other scenarios (q3R, q3A, q3B, q3C). These three representations are shown for three sets of state variables (metrics: DIN, Chla, TSS, Secchi, Bottom PAR; seagrass: Secchi, Bottom PAR, biomass of zostera, halophila and deep seagrass; and sediment exchange rates). There is a Table for each of two regions (Burdekin and Whitsundays).
A number of points can be made:
- The q3C scenario has very little impact on biogeochemical state.
- The q3R and q3B scenarios are of a similar magnitude in effect.
- q3A, the most aggressive reduction scenario, removes about 50 % of the anthropogenic change in state.
- Sensitivity to loads is most obvious in optical characteristics (Secchi depth), but through biogeochemical processes, also impact on other processes such as benthic production and sediment-water column exchanges.
Burdekin animations
Whitsundays animations
| State | Difference | Fraction | |
| Metrics (DIN, Chla, TSS, Secchi, Bottom PAR). | 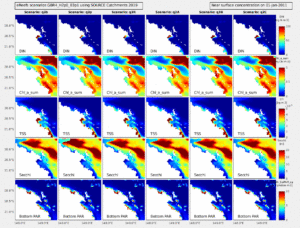 |
 |
 |
| Seagrass (Secchi, Bottom PAR, zostera, halophila, deep seagrass) | 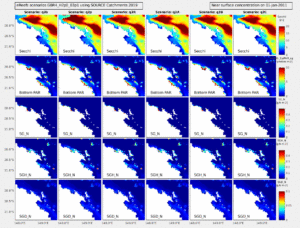 |
 |
 |
| Sediment exchange (sediment exchange of NO3, NH4, DIP, O2) | 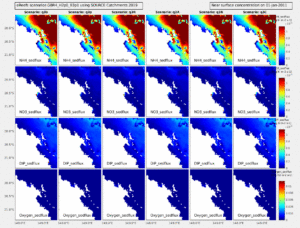 |
 |
 |

