Introduction
Now that we have an understanding of how to create and connect operations within Workspace, it's time to learn how to create a basic workflow in Workspace: reading, displaying, modifying and writing data. In this tutorial, we are going to read some data from a CSV file then display it in a chart. In the next tutorial we will learn how to modify and subsequently save this new data.
By the end of the tutorial, you will:
- Understand how to read data into Workspace
- Have created a chart from the data
- Displayed the chart in a widget
In the tutorial immediately following this one, we will be building on the workflow we create here in order to modify the data that we read in.
Just in case you get stuck, a sample workflow has been provided for you.
Contents
Extracting data from a CSV file
The first thing we're going to do is create an operation that reads our data.
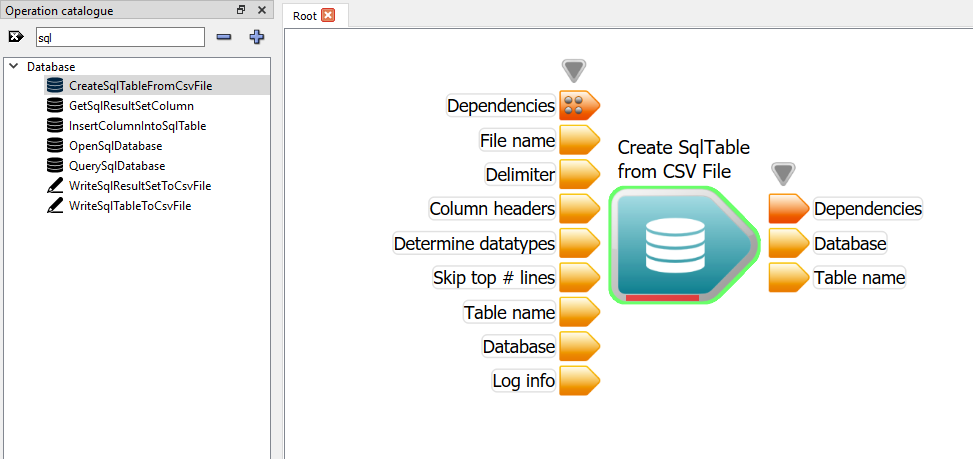
- In the Operation Catalogue, filter using the text "sql", then drag and drop the CreateSqlTableFromCsvFile operation onto the workspace.
Creating the SQL database and table from a CSV file
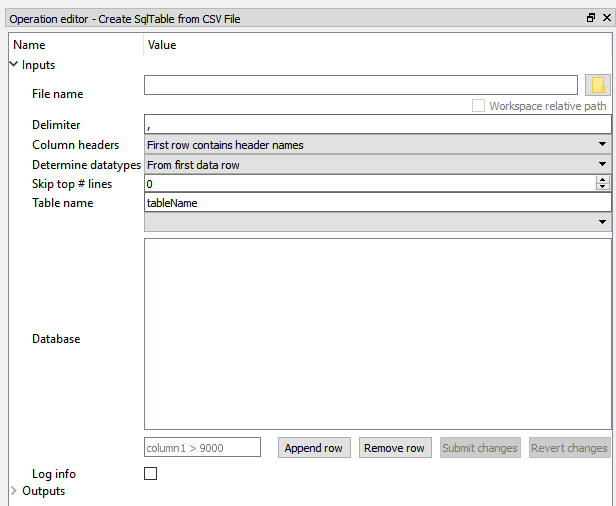
- Click on the CreateSqlTableFromCsvFile operation to select it. We will see in the Operation Editor that it has several inputs.
CreateSqlTableFromCsvFile - Operation Editor
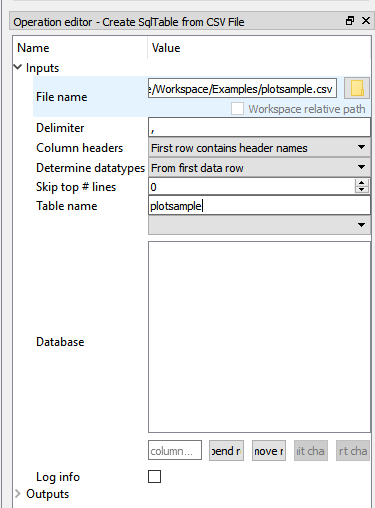
- Click on the browse button next to the File name text field and locate the
doc/Workspace/Examples/plotsample.csv. This file contains some measurements of grains, which we are going to display in a chart.
- Modify the Table name input to "plotsample"
CreateSqlTableFromCsvFile - Setting Operation Editor
Now we can read the CSV file. The CreateSqlTableFromCsvFile has two outputs (in addition to the Dependency output). These are: Database and Table name.
To get an idea of what's in the database, we can use a widget to display its contents. To do this:
- Create a WorkspaceOutput attached to the Database output of the CreateSqlTableFromCsvFile operation. Do this by right-clicking the Database output, and selecting Create workspace output in the context menu. Once this is done your workflow should look like this:
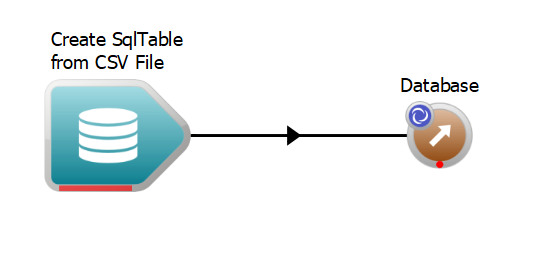
The first executable workflow of this tutorial
- Now right-click on the Database output and select Display with SqlDatabaseWidget in the context menu.
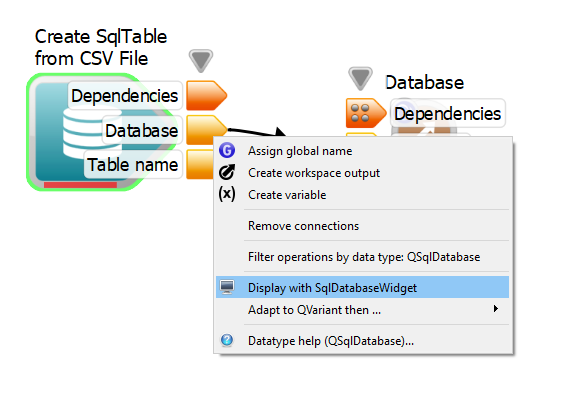
Selecting the display widget
- Execute the workflow
In the widget, we will see:
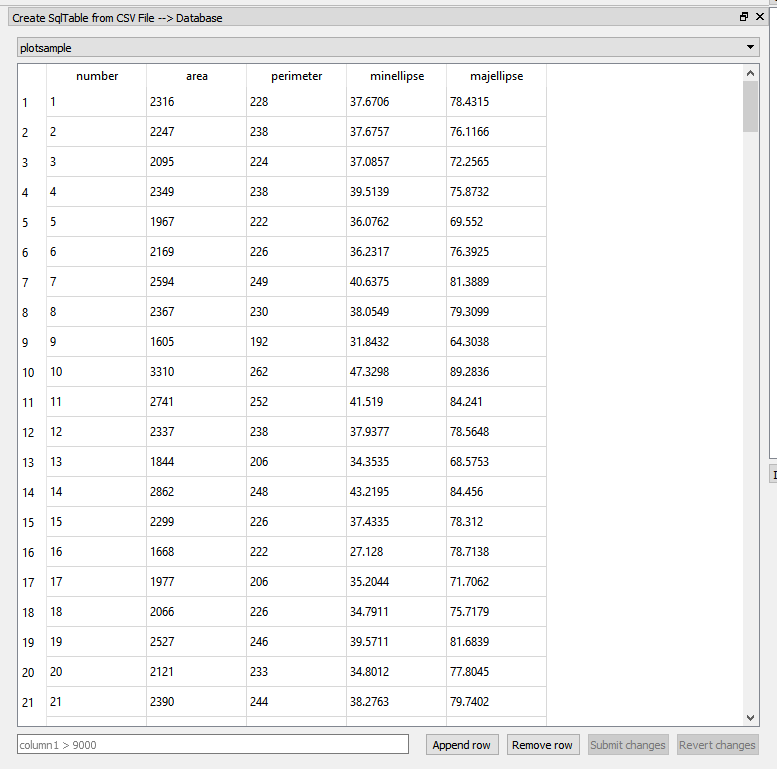
The CSV file read into a database table
The output tells us that there are 5 columns in our table named "number", "area", "perimeter", "minellipse" and "majellipse".
Extracting data from the SQL database
Now we need to extract the relevant columns from the database table. To do this:
- Stop the workflow. Select the Workspace output operation and delete it.
- From the Operation Catalogue, drag the QuerySqlDatabase operation onto the workspace canvas.
- Connect Database output of the CreateSqlTableFromCsvFile operation to the Database input of the QuerySqlDatabase operation
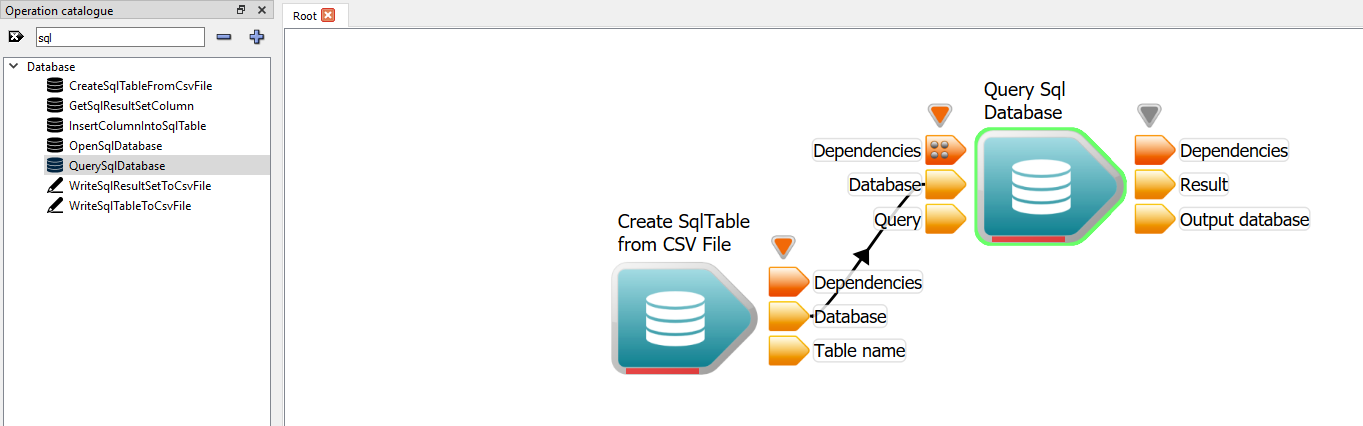
Connecting operation inputs and outputs
- Enter the following query in the QuerySqlDatabase operation - SELECT * FROM plotsample
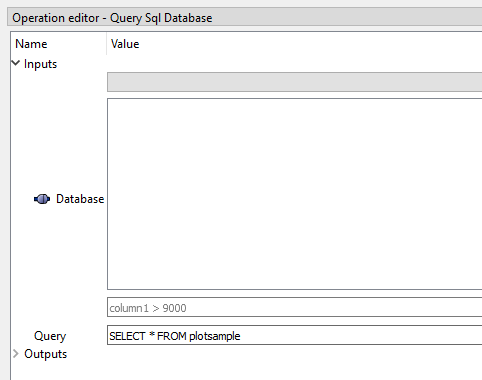
Enter the query
- From the Operation Catalogue, drag the GetSqlResultSetColumn operation onto the workspace canvas. Leave the Data type value as DataSeries.
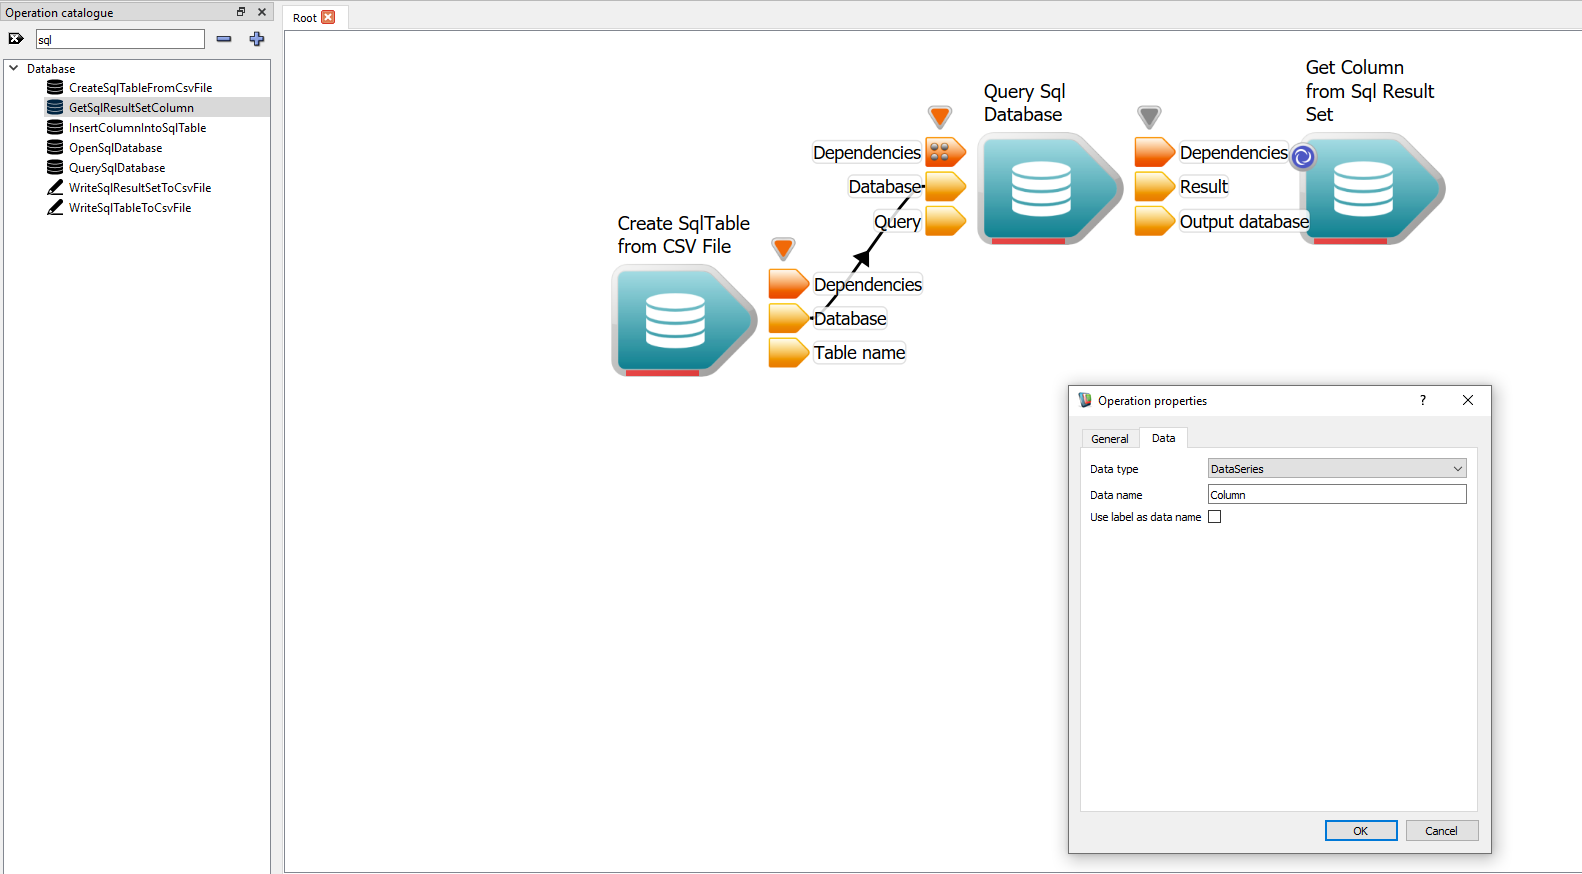
Get SQL result set column
- Connect Result output of the QuerySqlDatabase operation to the Result set input of the GetSqlResultSetColumn operation
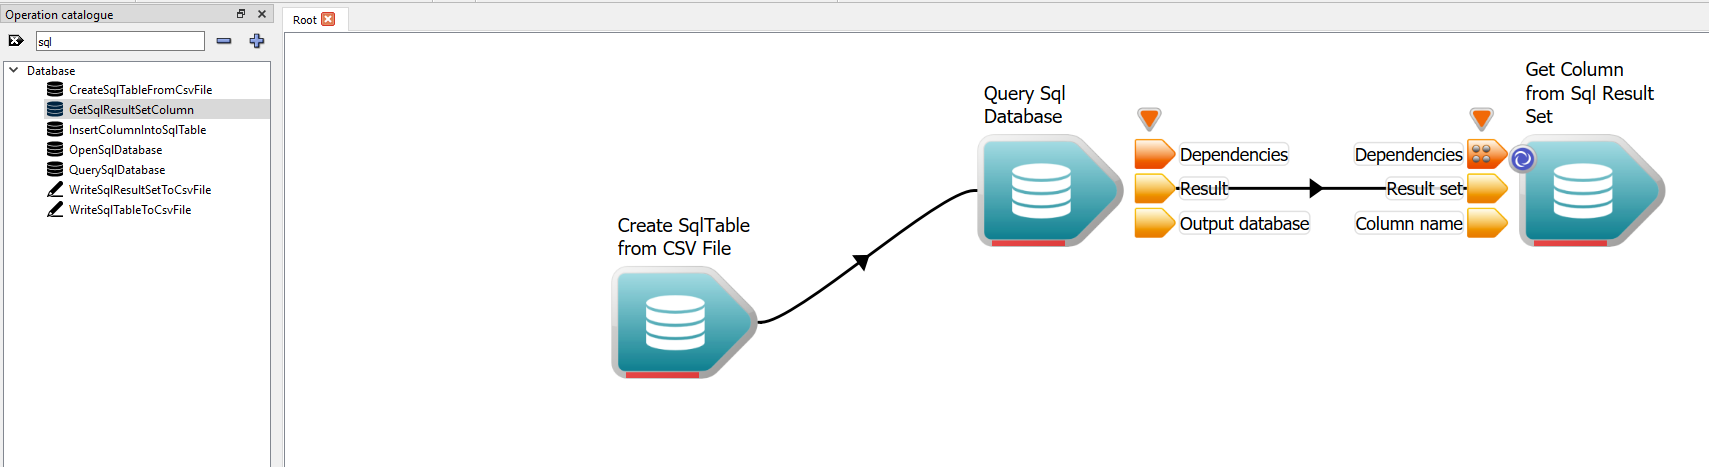
Connecting result set
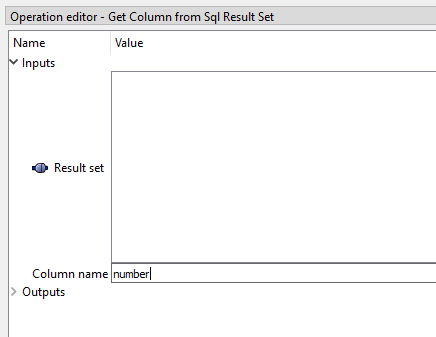
- We should manually provide a Column name. Select the GetSqlResultSetColumn operaton. In the operation editor, type "number" into the Column name input. This will extract the number column.
Extracting the number column
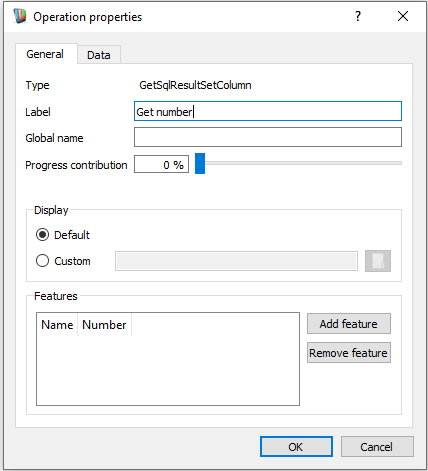
- Right-click on the GetSqlResultSetColumn operaton and select "Properties..." from the context menu. In the general tab, modify the label to "Get number".
Changing label to include column name 'number'
- From the Operation Catalogue, drag another GetSqlResultSetColumn operation onto the workspace canvas.
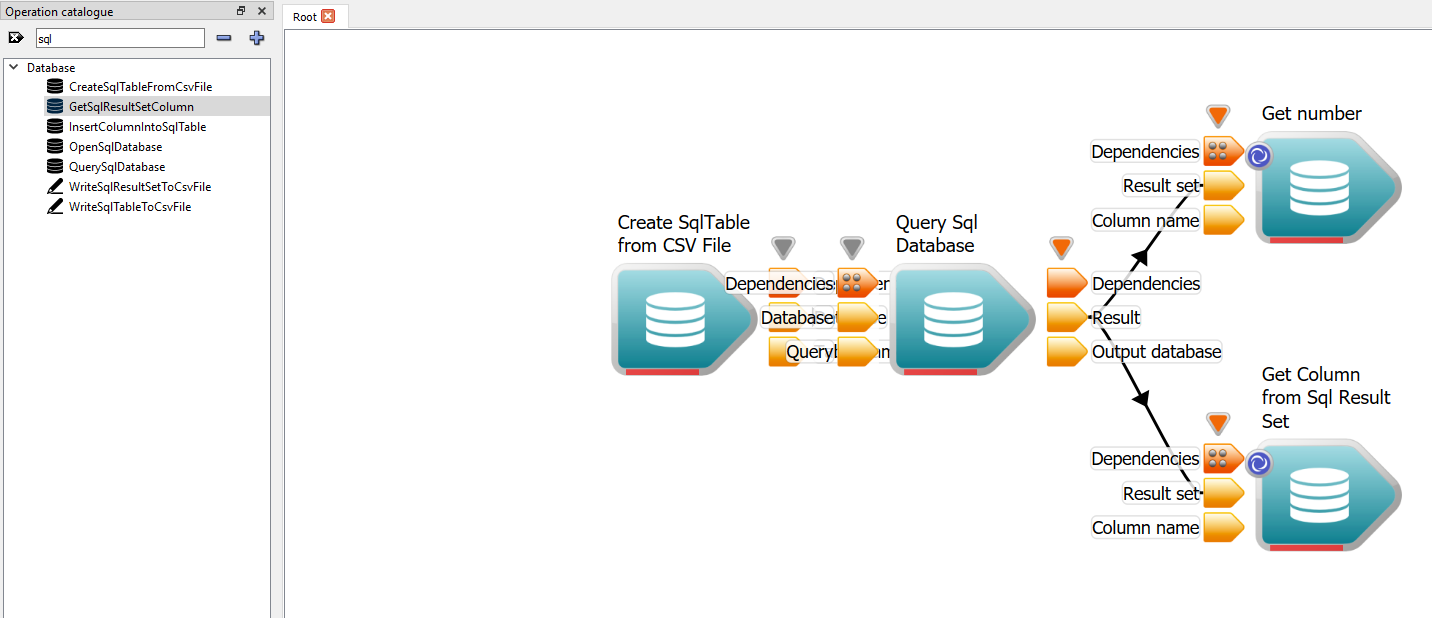
Get another SQL result set column
- In the operation editor of the second GetSqlResultSetColumn operation, type "area" into the Column name input. This will extract the area column.
Extracting the area column
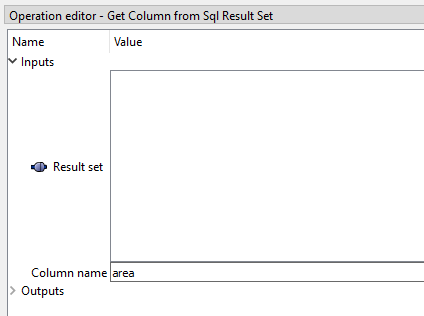
- Right-click on the second GetSqlResultSetColumn operaton and select "Properties..." from the context menu. In the general tab, modify the label to "Get area".
Changing label to include column name 'area'
Displaying the data in a chart
So far, we've set up our workflow to extract data from the SQL database table. Next up we are going to create a chart of the data we've extracted; we're going to display the "number" field versus the "area" field.
Now we need to create a chart, so let's find the operation that does that.
- In the Operation Catalogue, find the CreateChart operation and drag it onto the right hand side of the workflow.
Selecting the CreateChart operation
- Note
- Notice the little gear indicator icon on the CreateChart operation? It indicates that the operation has additional custom properties which you can left click on to bring up the relevant dialog window.
- Open the properties dialog for the CreateChart operation and select the Chart inputs tab. We will see that it has a number of predefined chart types in the Chart Template dropdown list.
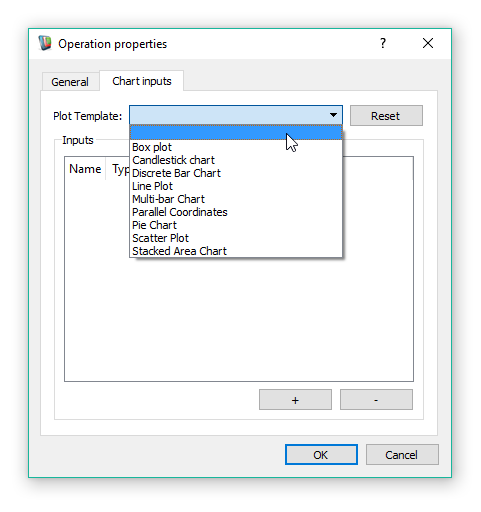
Initial CreateChart properties
- Select Line Plot from the list of templates and click Reset
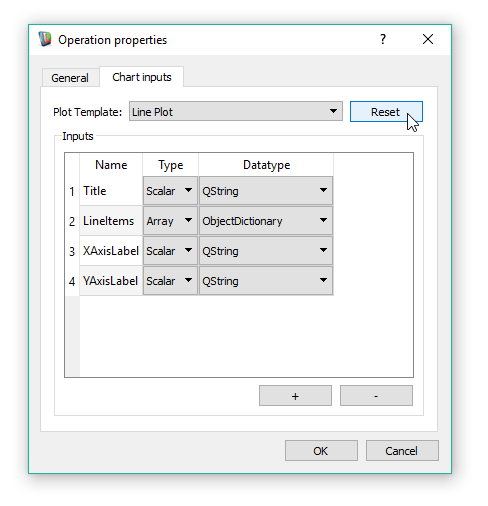
Selecting Line Plot and setting the values
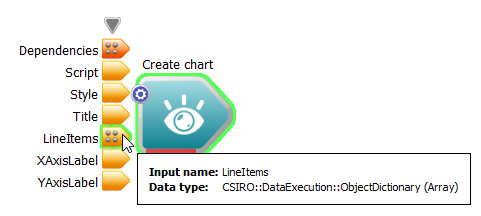
- Close the Properites dialog and look at the inputs to our CreateChart operation. You can see that all the inputs neded to build a Line Plot have been added to the opertion. Please note the "Line items" input which will contain the data to be plotted.
Updated CreateChart inputs
- Since the CreateChart operation requires a ObjectDictionary input we will need to create one. In the Operation Catalogue, find the CreateChartObjectDictionary operation and drag it onto the canvas.
Adding a CreateChartObjectDictionary operation
- If we start to drag the Column output of one of our GetSqlResultSetColumn operations, we will see that it is compatible with the XValues and YValues inputs of our CreateChartObjectDictionary operation. Connect the extracted "number" column to XValues and the "area" column to YValues.
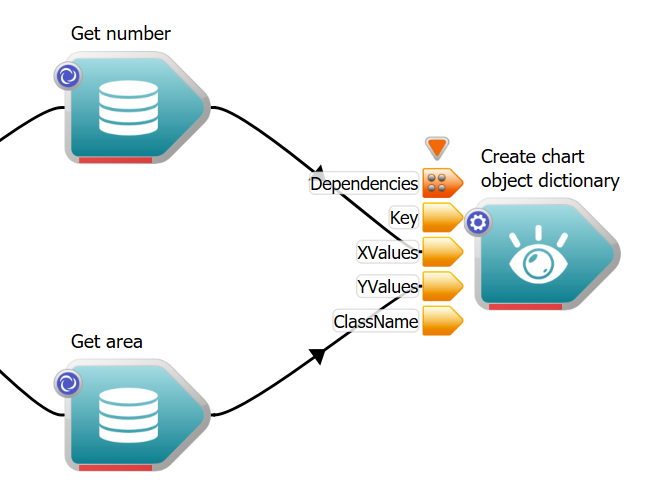
Connections to CreateChartObjectDictionary operation
- Connect the Chart data output of our CreateChartObjectDictionary operation to the Lineitems array input of our CreateChart operation.
- Now we should add some meaningful text to the CreateChart operation inputs:
- set Title to Read and Display tutorial
- set XAxisLabel to Number
- set YAxis Label to Area
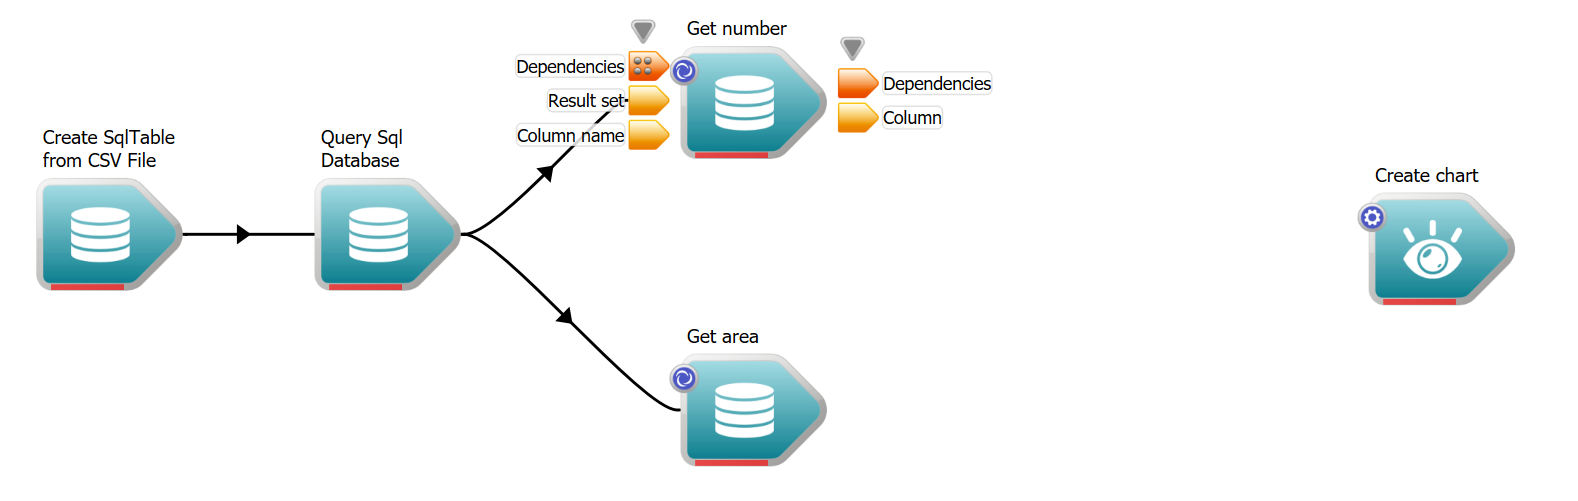
- Create a WorkspaceOutput attached to our CreateChart's Chart output. Your workflow will look something like this:
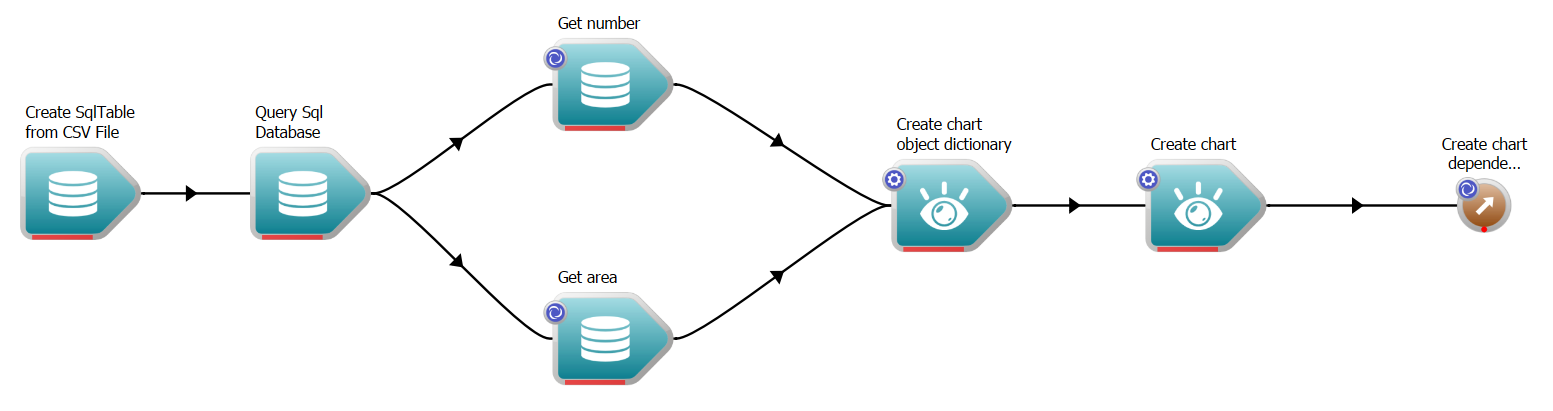
The workflow after adding CreateChartObjectDictionary and CreateChart
- Execute the workflow
Displaying the chart
Our workflow has now created a Chart. So how do we visualise it?
- Right click on the Chart output of the CreateChart operation to display its context menu. In it, you will notice an item at the very bottom that says "Display with Chart Widget". Click this menu item.
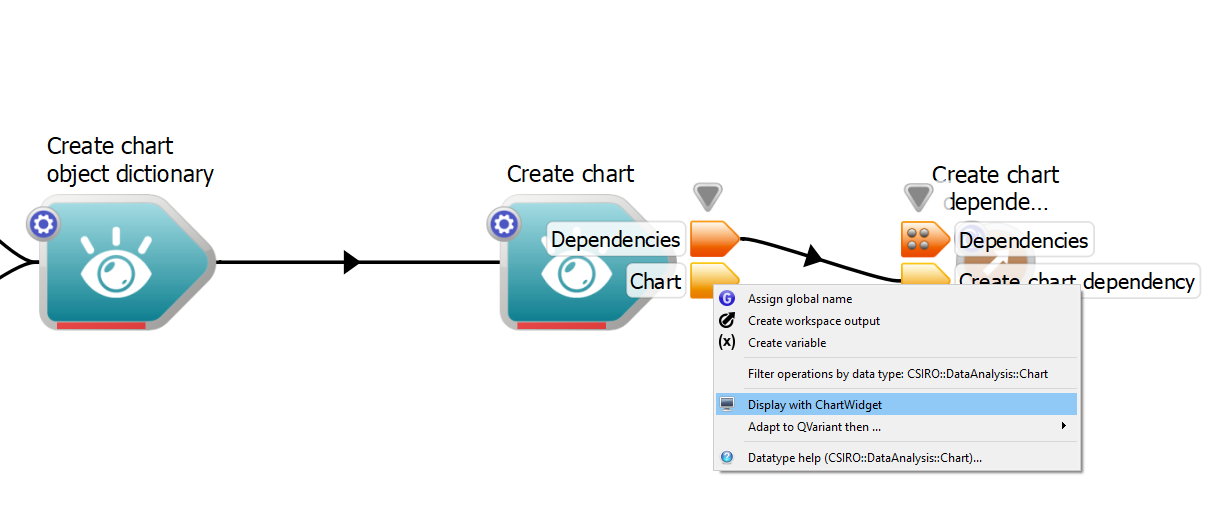
Display context menu
- This will create a ChartWidget, which is a highly configurable widget for displaying charts. The line being plotted on the chart corresponds to the Lineitems values we built using the "number" and "area" fields.
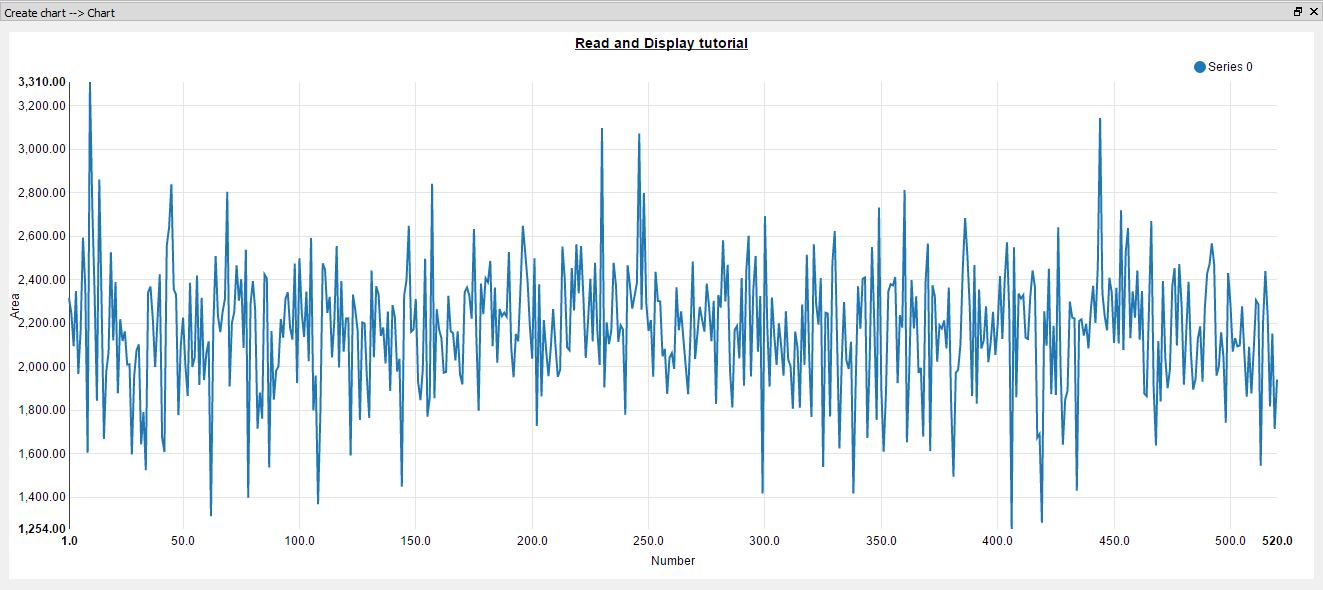
The chart widget display of our chart item
If you open the Properties dialog for the CreateChart opertion you will see that there are a number of Chart types. Many of these will work with the current configuration (but not all). Feel free to explore these charts to get a better understanding of how a chart can be customised.
Important note: A widget attached to an input or output is identical to having a WorkspaceOutput attached directly to that input or output. When the workflow is executed, it will attempt to bring all out-of-date Operations on the path to the input / output up-to-date. For more information about this, see Understanding how a Workflow Executes.
Summary
Well done! You've reached the end of the second Workspace tutorial. You should now have an understanding of how Workspace can be used to:
- Read data from a file
- Display the results using a special widget
A complete sample workflow for this tutorial can be found here, just in case you ran into any issues along the way, or want to compare your results to others.
For more information on some of the concepts covered, see the below:
Next Steps
The next tutorial builds on the workflow we have constructed here. In it, we will modify the data we have read and output it to a file.