Introduction
In the previous tutorial, we read some data from a CSV file and displayed it using a chart widget. In this tutorial, we are going to build on the workflow that we constructed previously. We are going to use Workspace to modify our CSV data, and write it to a new file.
Note that in order to complete this tutorial, you will need to start with the workflow that was constructed in the previous tutorial, Reading and displaying data. If you have not completed this tutorial, you can start with this sample workflow.
By the end of the tutorial, you will:
- Understand how to modify a data series in Workspace
- Understand how to write CSV and image data to file
Just in case you get stuck, a sample workflow has been provided for you.
Contents
Modifying data
So far, our workflow reads some data from file and displays it in a chart. Let's use Workspace to modify our data without having to change the contents of the source file. In this case, we are going to modify our chart so that instead of displaying the raw data, it displays the cumulative average of the area for each item in the data set.
- Disconnect our "Get area" operation from the CreateChartObjectDictionary by right clicking on the connection line and selecting "Remove connection" (as shown here):
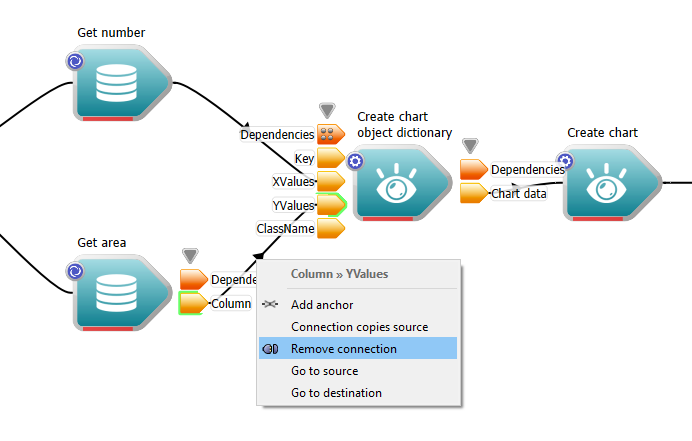
Disconnect our get area column operation from the CreateChartObjectDictionary operation
- You may want to rearrange your workflow as shown in the image below to create some space for other operations we will add.
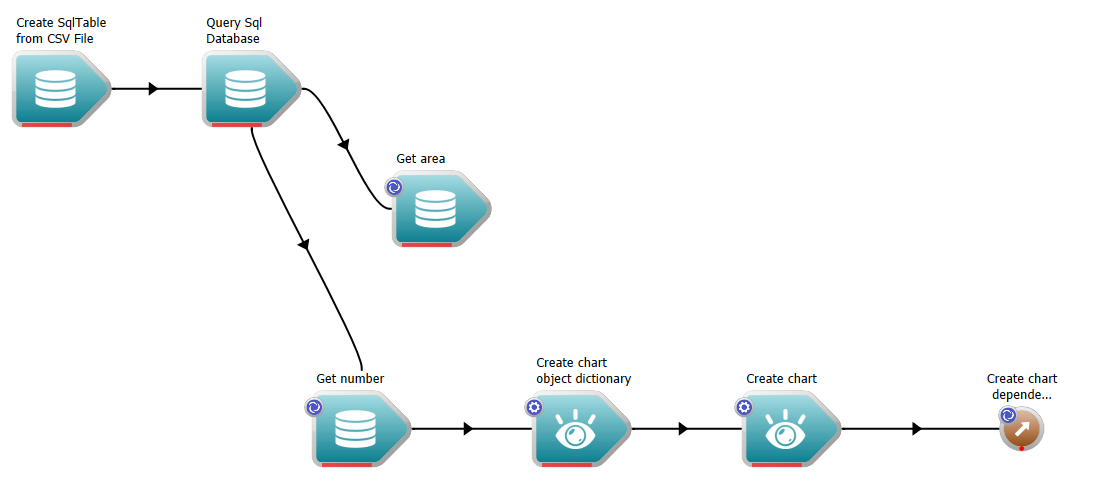
Rearrange the workflow
- In the Operation Catalogue, find the MapDataSeries operation and drag it onto the canvas. This operation allows us to map each value in a data series to an alternative value; effectively transforming the entire dataset.
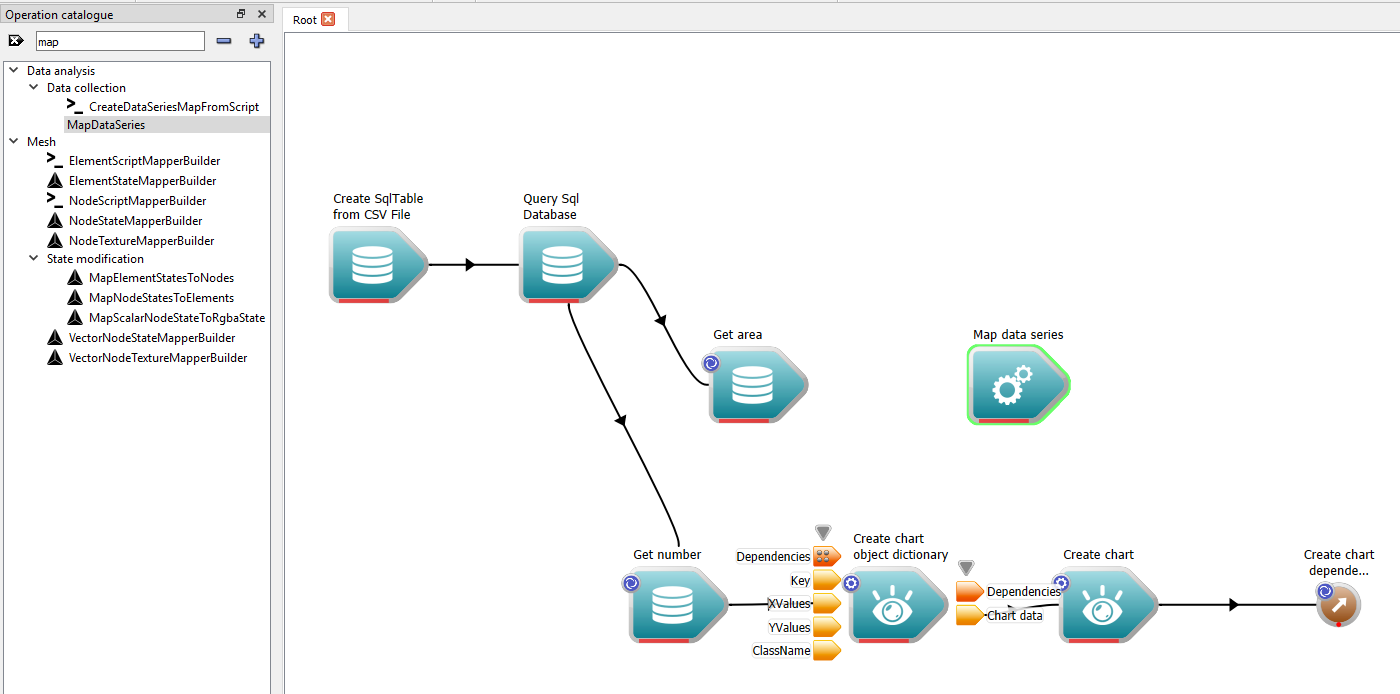
Creating the MapDataSeries operation
- Now connect the Data series output of the MapDataSeries operation to YValues of the CreateChartObjectDictionary operation.
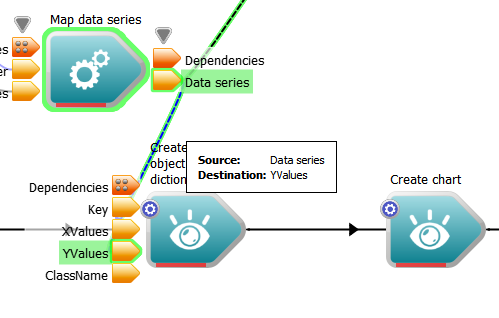
Connect mapped DataSeries to the YValues
- If we look at our MapDataSeries operation, we will see that it has two inputs:
- Mapper: An object that is responsible for mapping each value in the original data series to a new value.
- Data series The data series we are going to map.
- Connect the "Column" output from the "Get area" operation to the Data series input on the MapDataSeries operation.
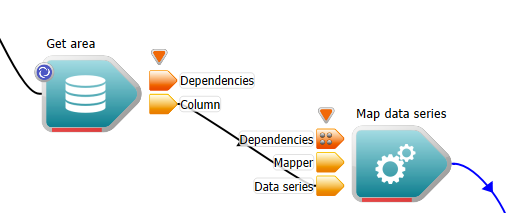
Connect area DataSeries
- Now we need to create a mapper. From the Operation Catalogue, drag a CreateDataSeriesMapFromScript operation onto the canvas. This will allow us to create a special type of data series mapper that can be customized via a script.
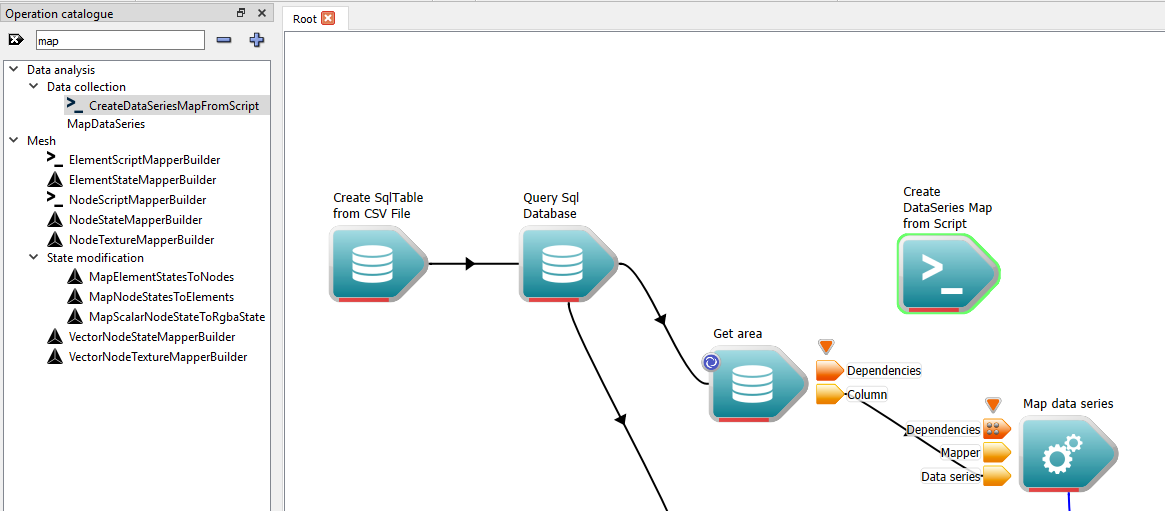
Creating the data series mapper
- Connect the DataSeries mapper output of the CreateDataSeriesMapFromScript operation to the Mapper operation of our MapDataSeries operation.
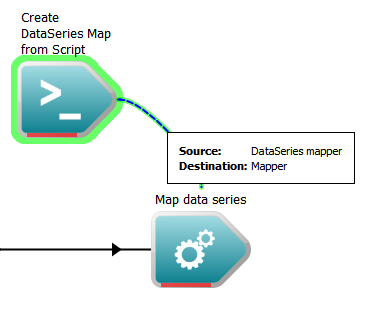
Connecting the mapper
- Now we need to enter some script code and we have two choices on how to do this, although they both accomplish the same result essentially using the same mechanisms. You can either: Select the CreateDataSeriesMapFromScript operation and edit the script input in the Operation editor, or Right click on the Script input of the CreateDataSeriesMapFromScript operation and select the "Display with Custom .ui file" option in the context menu. The second method is activated like this:
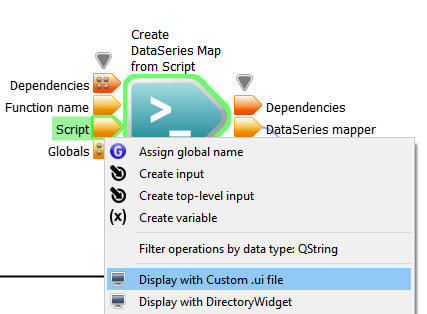
Creating the text editor to edit the script
Whichever method you use is fine. The real difference between to two methods is that with the first method method the operation must be selected to see the script in the input while with the second method the script will stay visible until you shut the widget (although it therefore consumes some extra screen real estate.)
- Initially, the widget contains a script that essentially does nothing.
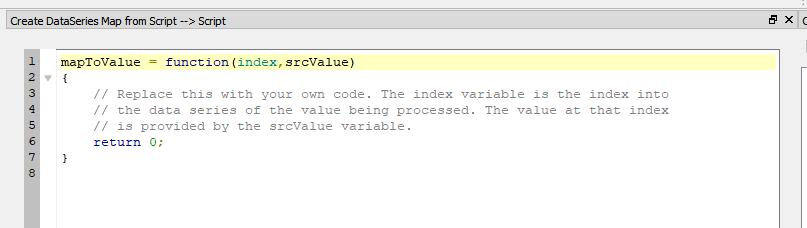
Default script
- Now we need to enter the script for performing a cumulative average into the widget. Replace all of the text in the widget with the following:
cumAvg = 0;
function mapToValue(index,srcValue)
{
   // Make sure we always reset our global variable for the first index
   if (index === 0)
   {
      cumAvg = 0;
   }

   cumAvg = (srcValue + index * cumAvg) / (index + 1);
   return cumAvg;
}
Here, we create a function called mapToValue which accepts an index and source value, and returns the cumulative average of the value. It is invoked when each data value needs to be mapped (this is done on-the-fly when values from the data series are requested). Note: Don't worry about understanding the contents of the script right now - just copy-and-paste it into the text editing widget. The next tutorial, Performing calculations (with QtScript), will help you understand more about how script operations work in Workspace.
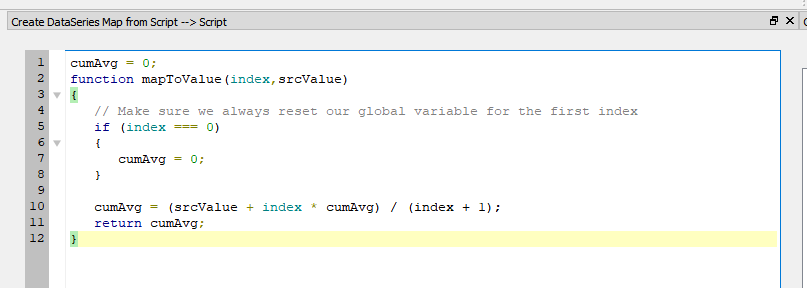
Script for cumulative average of the area
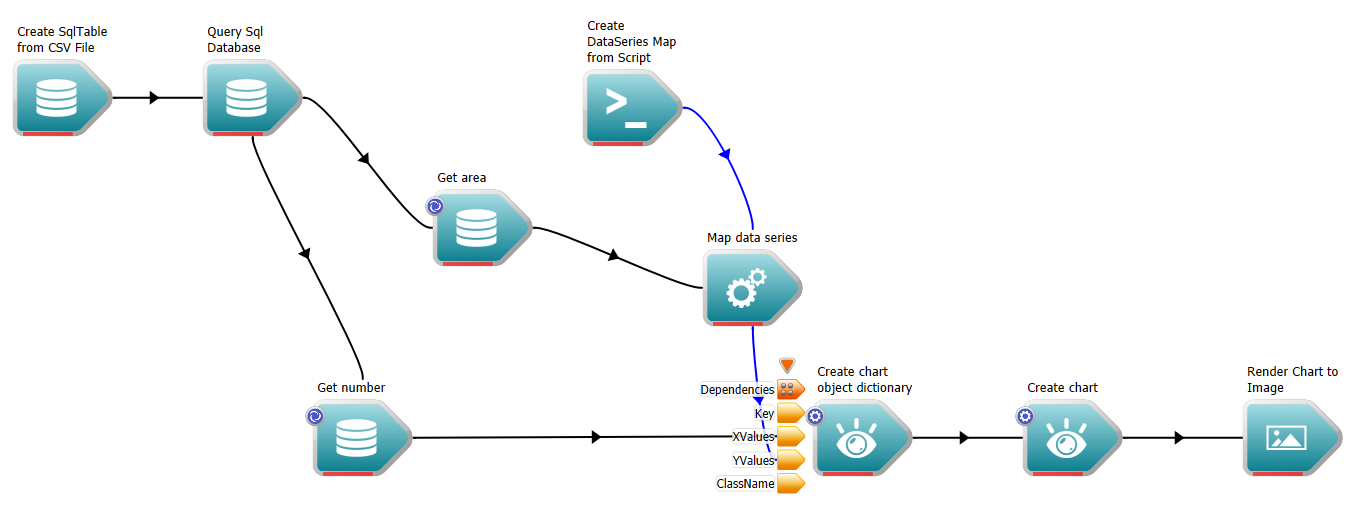
- Execute the workflow. Note that the widget updates instantly.
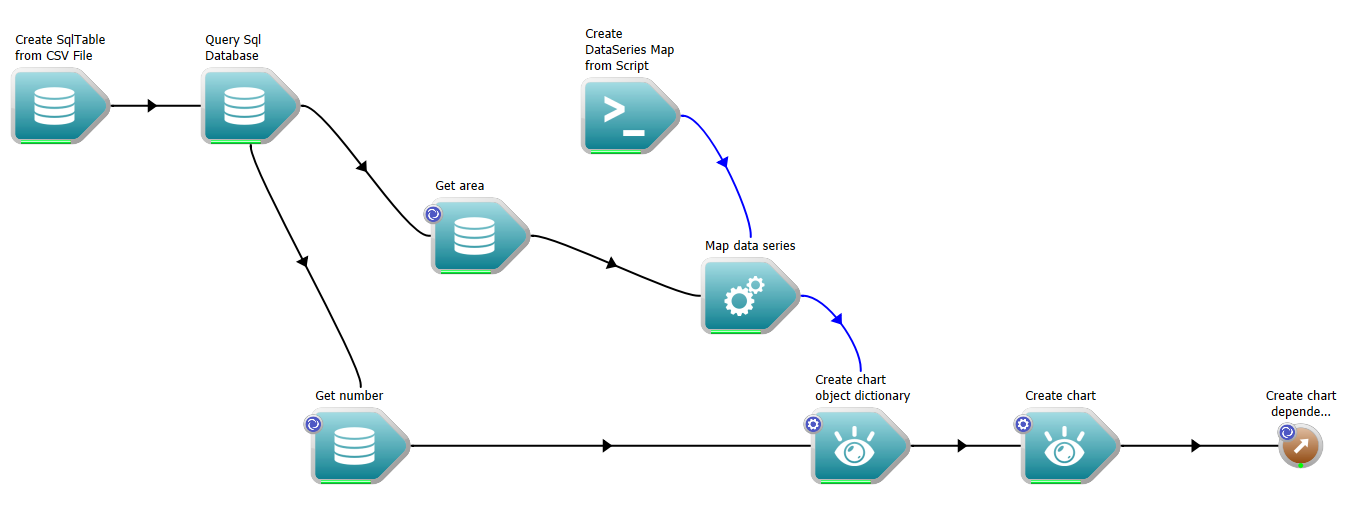
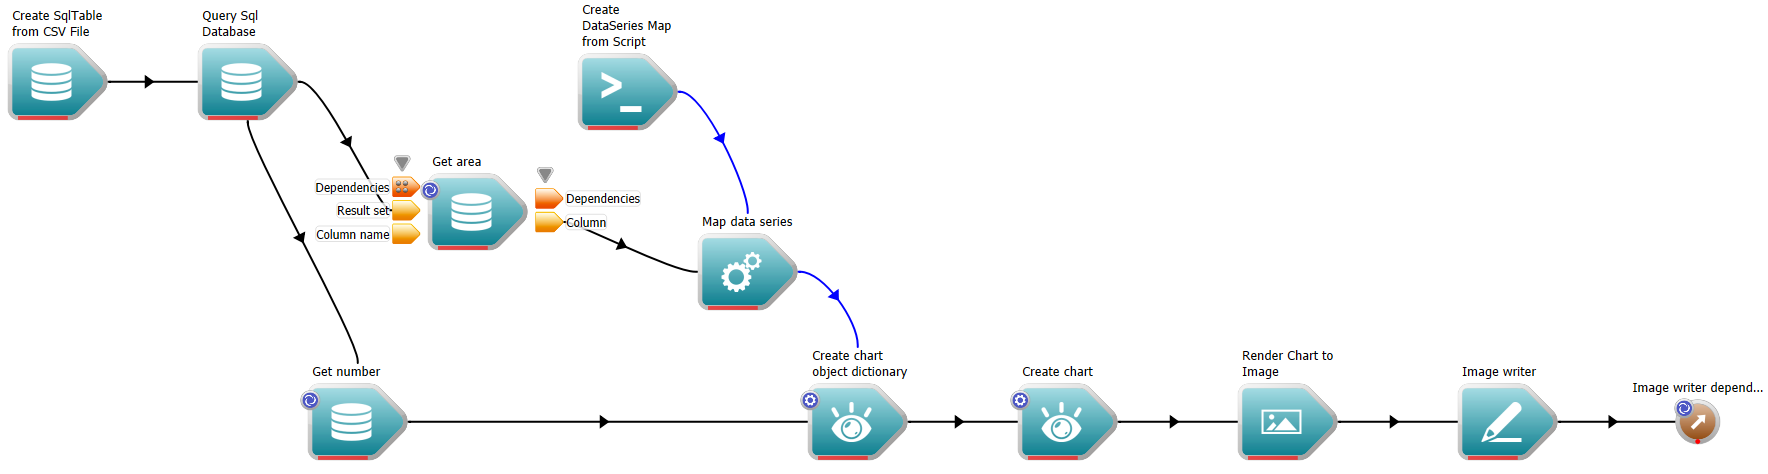
The workflow after adding the data mapping operations
- Since you may be using your workflow from the last tutorial, you may want to change some aspects of the Chart, for example:
- Change the title to "Modify and Save Tutorial"
- Change the YAxisLabel to "Cumulative Area"
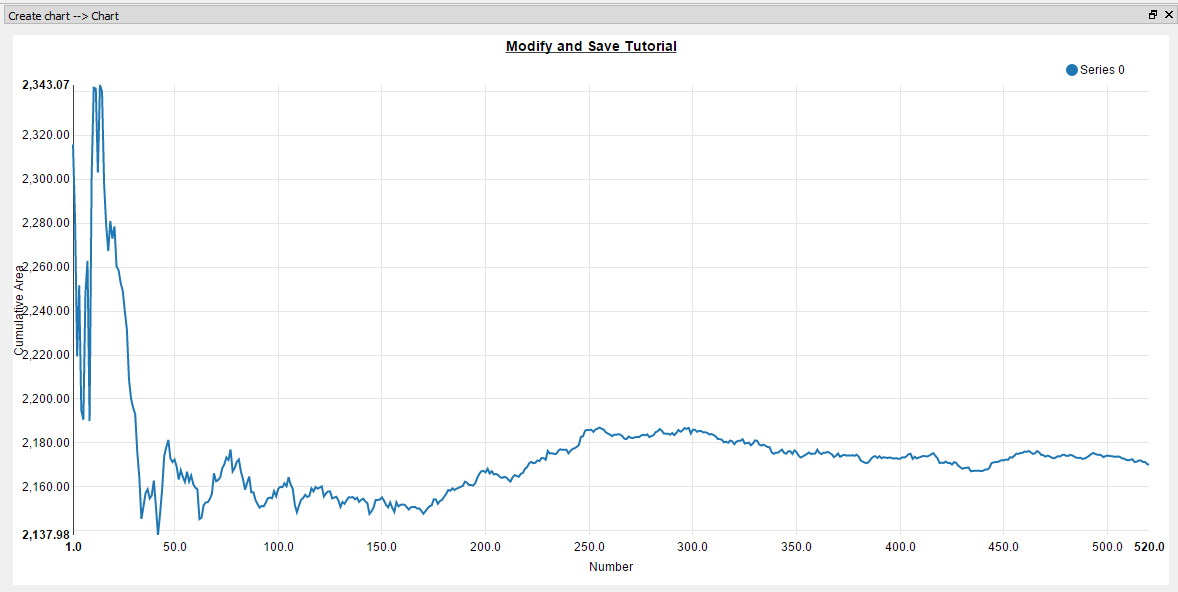
The updated chart
- Note
- There are a number of other operations in Workspace which are able to be customized with scripts. See the RunQtScript, RunPythonScript and RunRScript documentation and the Performing calculations (with QtScript), Embedding a Python script into a workflow and Utilising the power of R within Workspace workflows tutorials for more information. Additionally you can use the SystemCommand operation to call out to other languages and executables.
Writing our results to file
Now that we've read, modified and displayed some data, it's time to output the results to a file. We're going to do this with two different writers. Firstly we use a Chart to image writer for our chart. Then we will insert the cumulative average values to the database table we created in the CreateSqlTableFromCsvFile operation and write the table to a CSV file.
Writing the chart to a file
The first thing we are going to do is write our Chart to file. To do this:
- You can delete the WorkspaceOutput on the CreateChart operation. From the Operation Catalogue, find the ChartToImage operation and drag it onto the canvas and place it where you just deleted the WorkspaceOutput.
Creating the ChartToImage operation
- Find the ImageWriter operation and drag it onto the canvas.
- Connect the Chart output of the CreateChart operation to the Chart input of the ChartToImage operation.
- Connect the Image output of the ChartToImage operation to the Image input of the ImageWriter operation.
Creating the ImageWriter operation
- Click on the ChartToImage to select it, and in the Operation Editor, set
- its Width input to 1024
- its Height input to 768.
- its Render timeout (msec) input to 5000
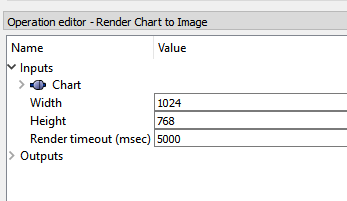
ChartToImage operation editor
- Click on the ImageWriter to select it, and in the Operation Editor, set
- its File name input to ws:outputimage.png
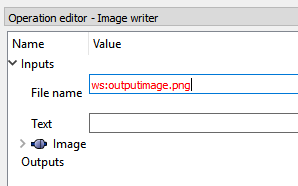
ImageWriter operation editor
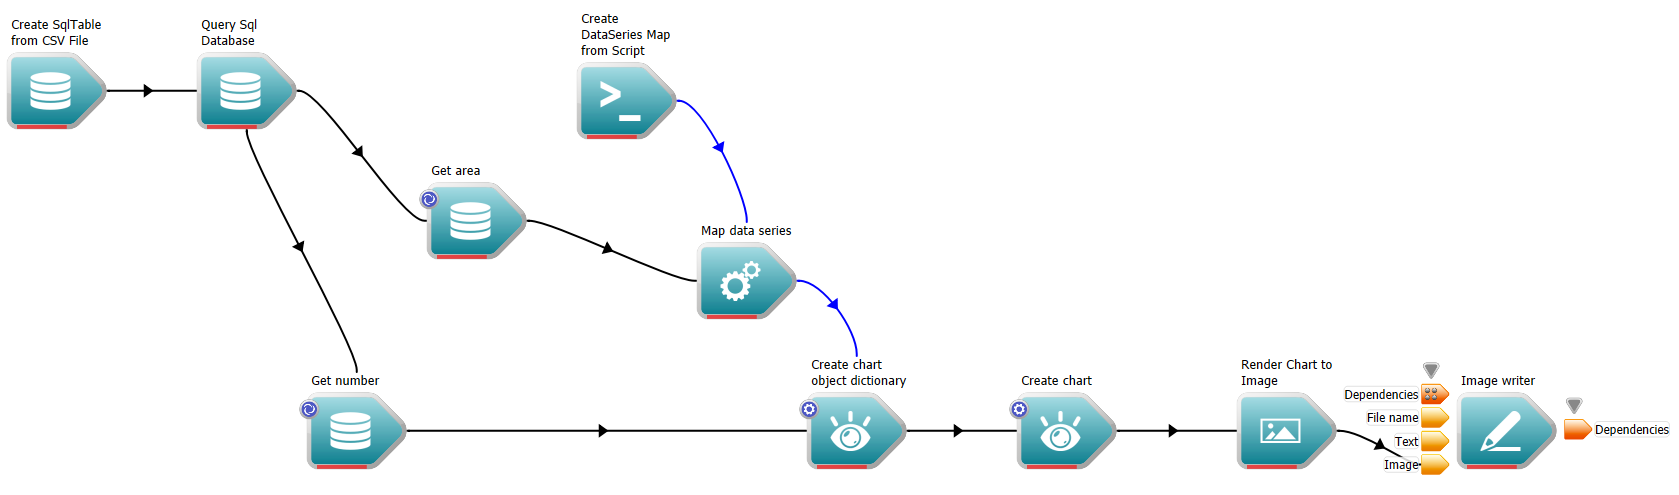
- Create a WorkspaceOutput operation attached to the dependencies output of the ImageWriter. Your workflow should look something like this:
The workflow, with the new Chart writing operations
- Execute the workflow.
- You can see the output in the Log window:
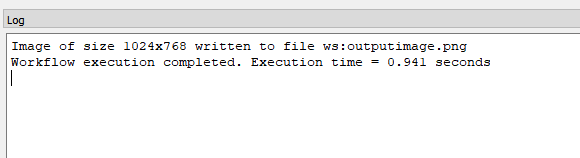
Logged output
- You can see the Chart in a number of ways, a simple way is to look at the Chart input of the RenderChart to Image operation in the Operation editor. The ChartWidget display is shown in the image below.
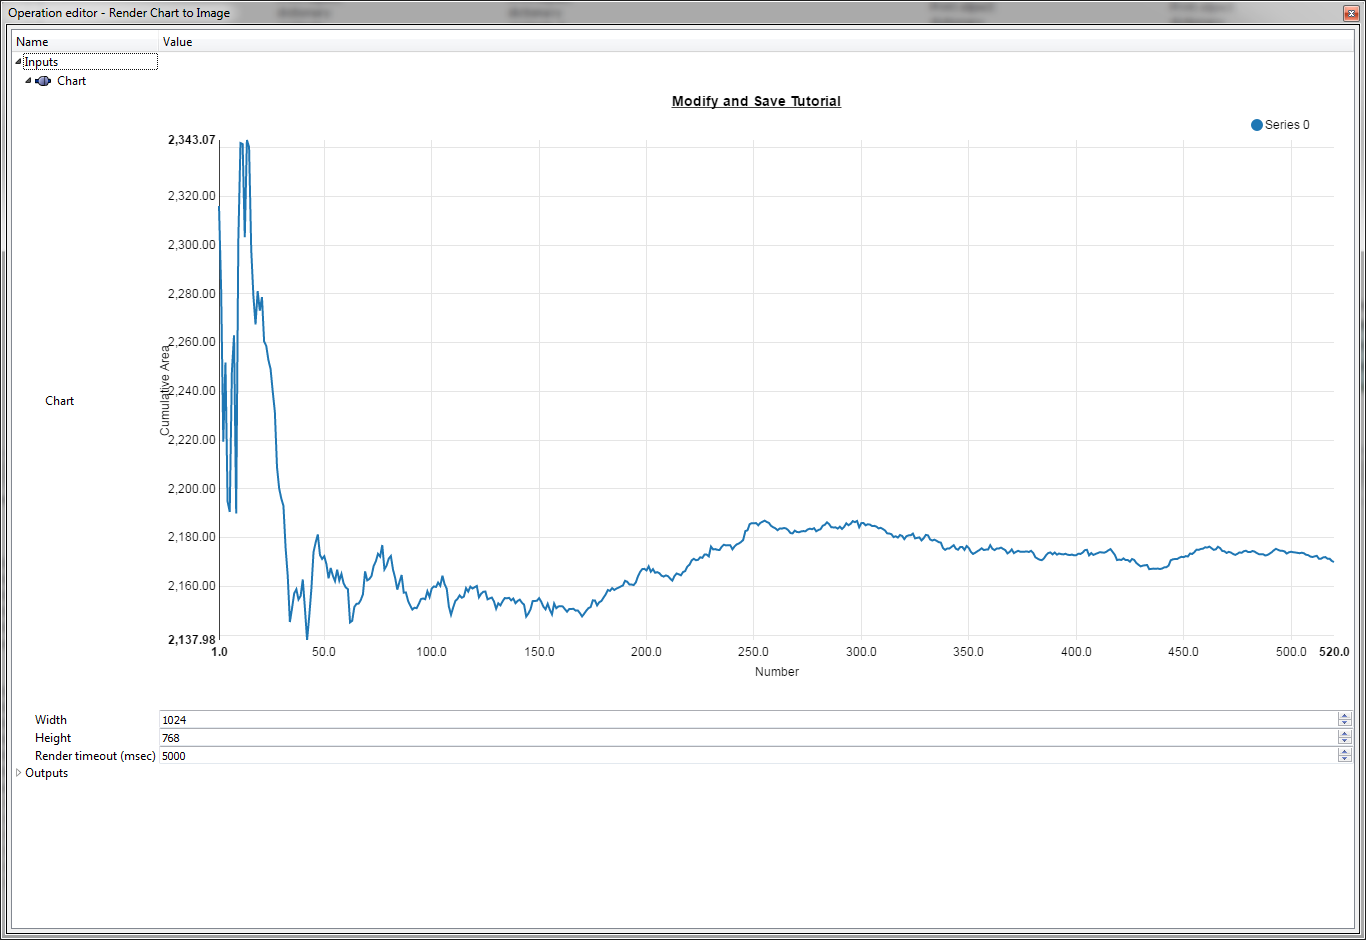
The Chart input of the Render Chart to Image operation
Writing the cumulative average values to a CSV file
- From the Operation Catalogue, find the InsertColumnIntoSqlTable operation and drag it onto the canvas. This operation will insert the newly created DataSeries values i.e. the cumulative average values into the SQL database table created by the CreateSqlTableFromCsvFile operation. We can query the altered table and write the result to a CSV file.
Inserting the cumulative average DataSeries to a SQL table
- Connect the Database output of the CreateSqlTableFromCsvFile operation to the Database input of the InsertColumnIntoSqlTable operation.
- Connect the Table name output of the CreateSqlTableFromCsvFile operation to the Table name input of the InsertColumnIntoSqlTable operation.
- Connect the DataSeries output of the MapDataSeries operation to the Data input of the InsertColumnIntoSqlTable operation.
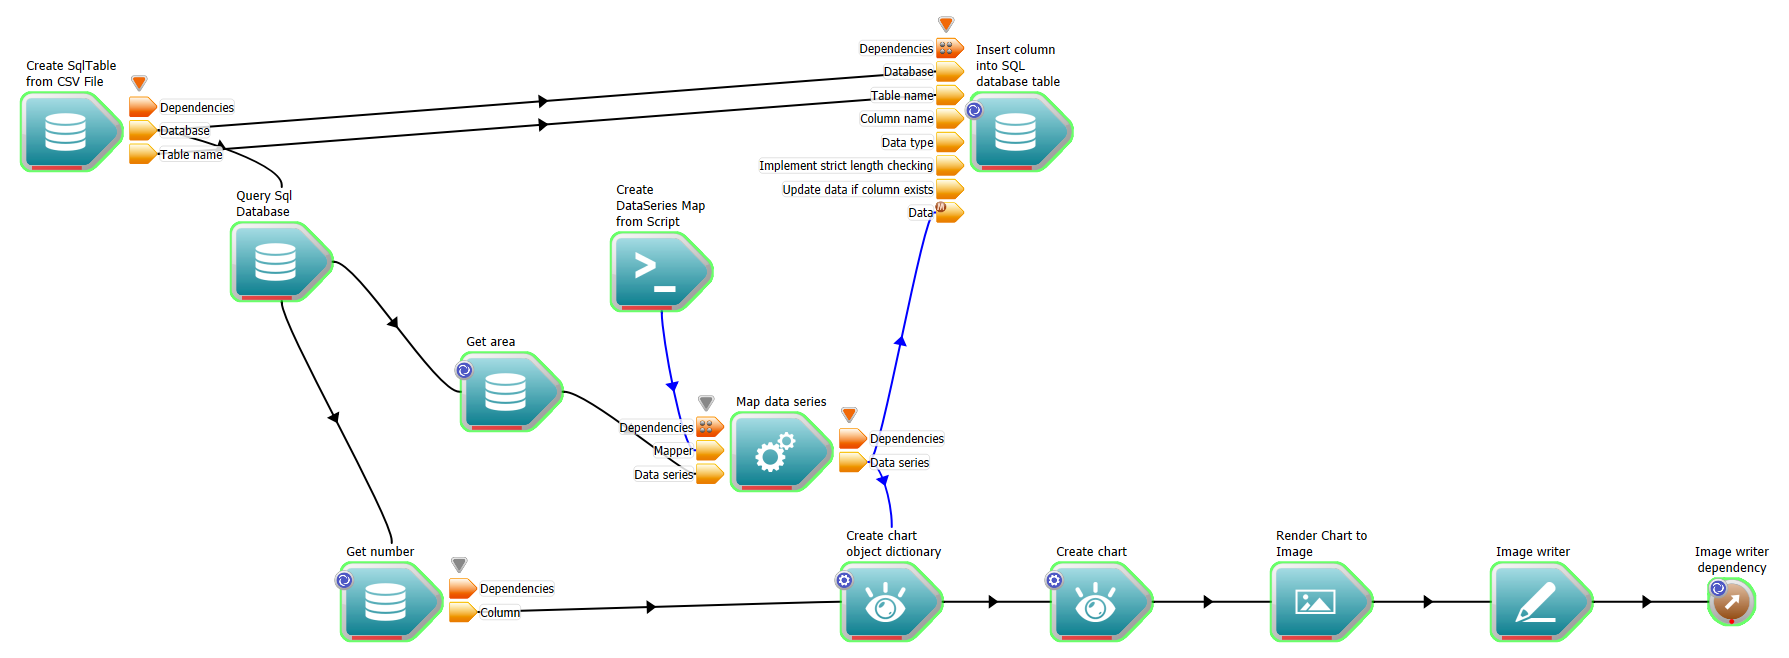
Connections for the InsertColumnIntoSqlTable operation
- Select the InsertColumnIntoSqlTable operation.
- In the operation editor,
- Set the Column name to cumulativeAverage
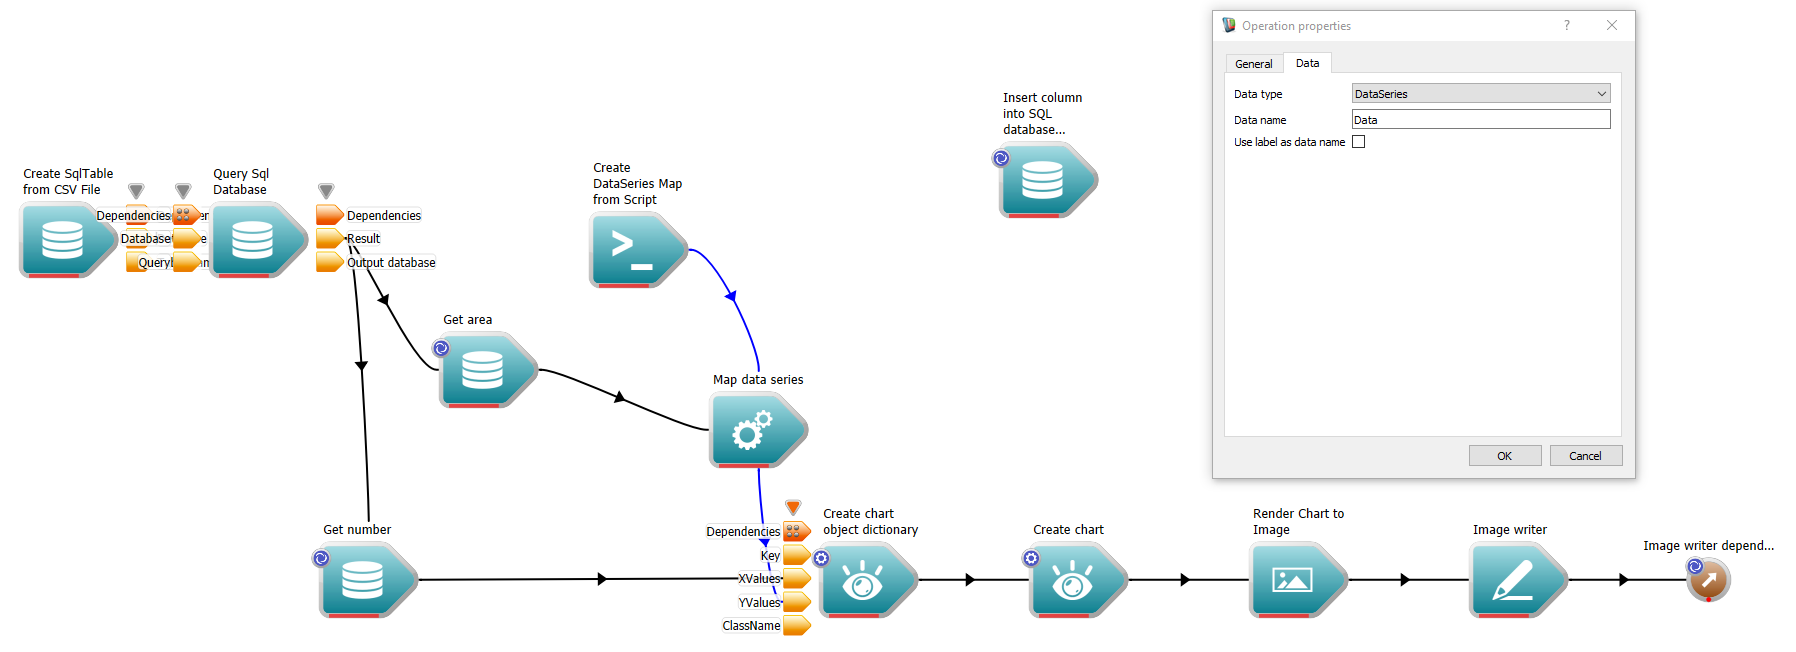
- Set the Data type to DOUBLE
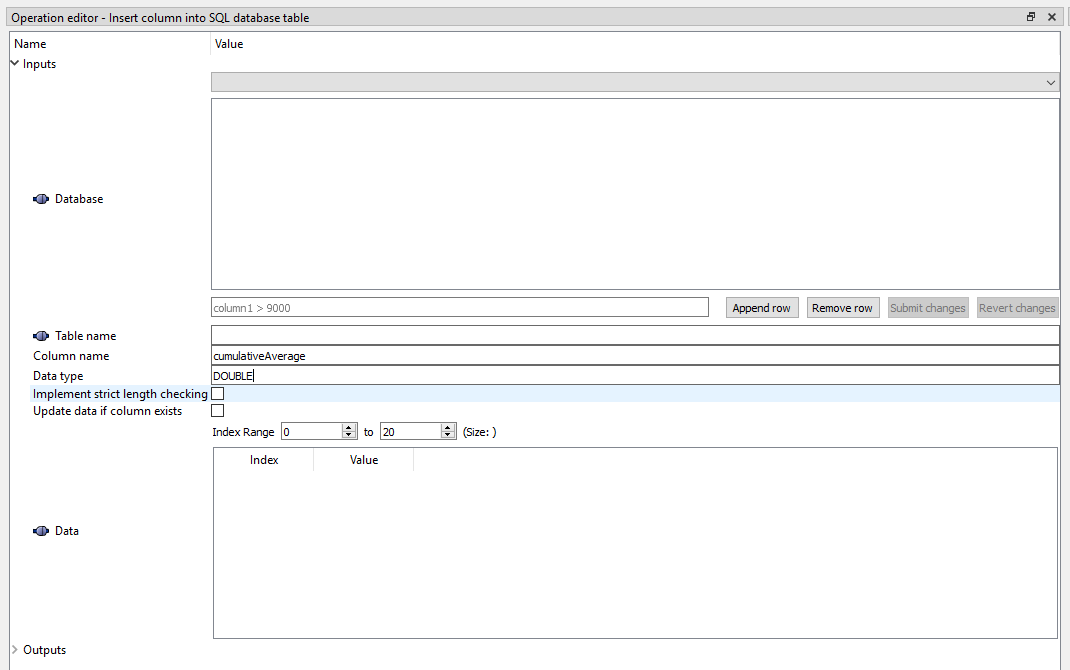
InsertDataSeriesIntoSqlDatabase operation editor
- From the Operation Catalogue, find the QuerySqlDatabase operation and drag it onto the canvas.
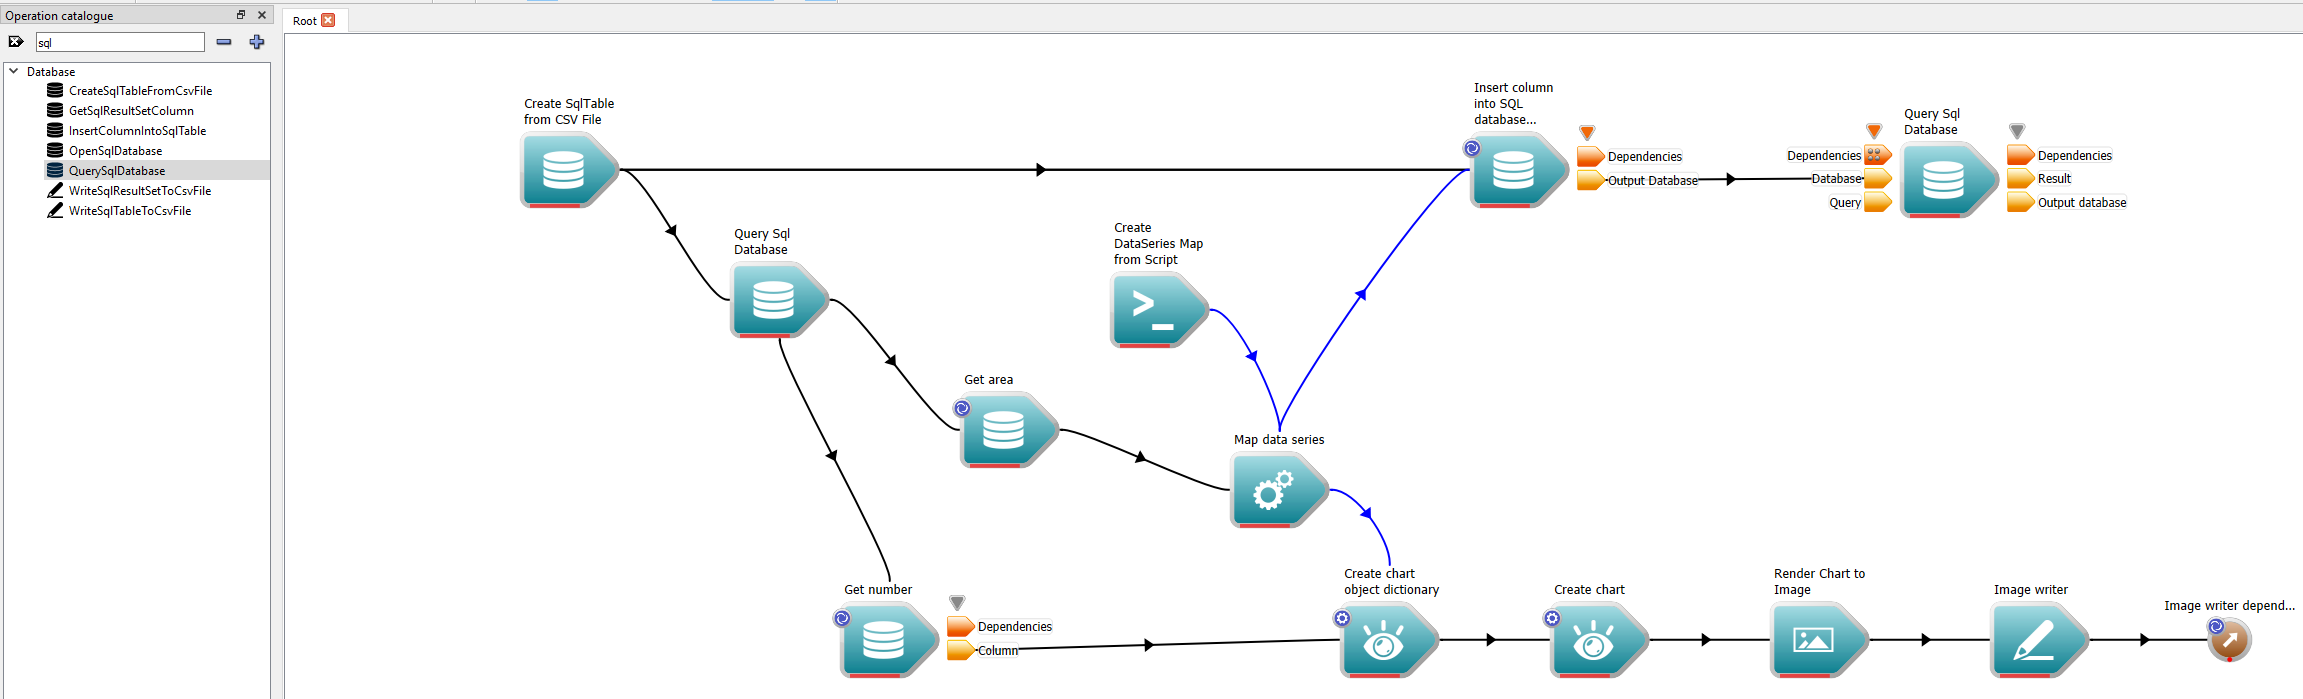
Get table with added column
- Select the newly added QuerySqlDatabase operation.
- In the operation editor, set the Query input to "SELECT * FROM plotsample"
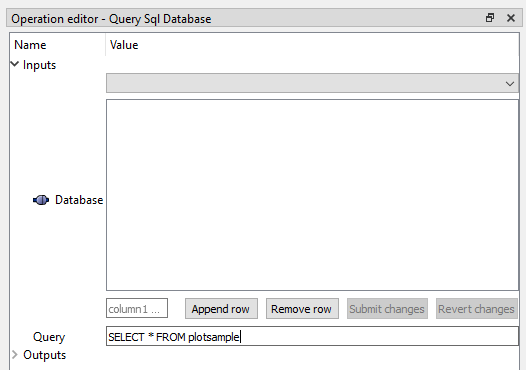
Query to get table with newly added column
- From the Operation Catalogue, find the WriteSqlResultSetToCsvFile operation and drag it onto the canvas.
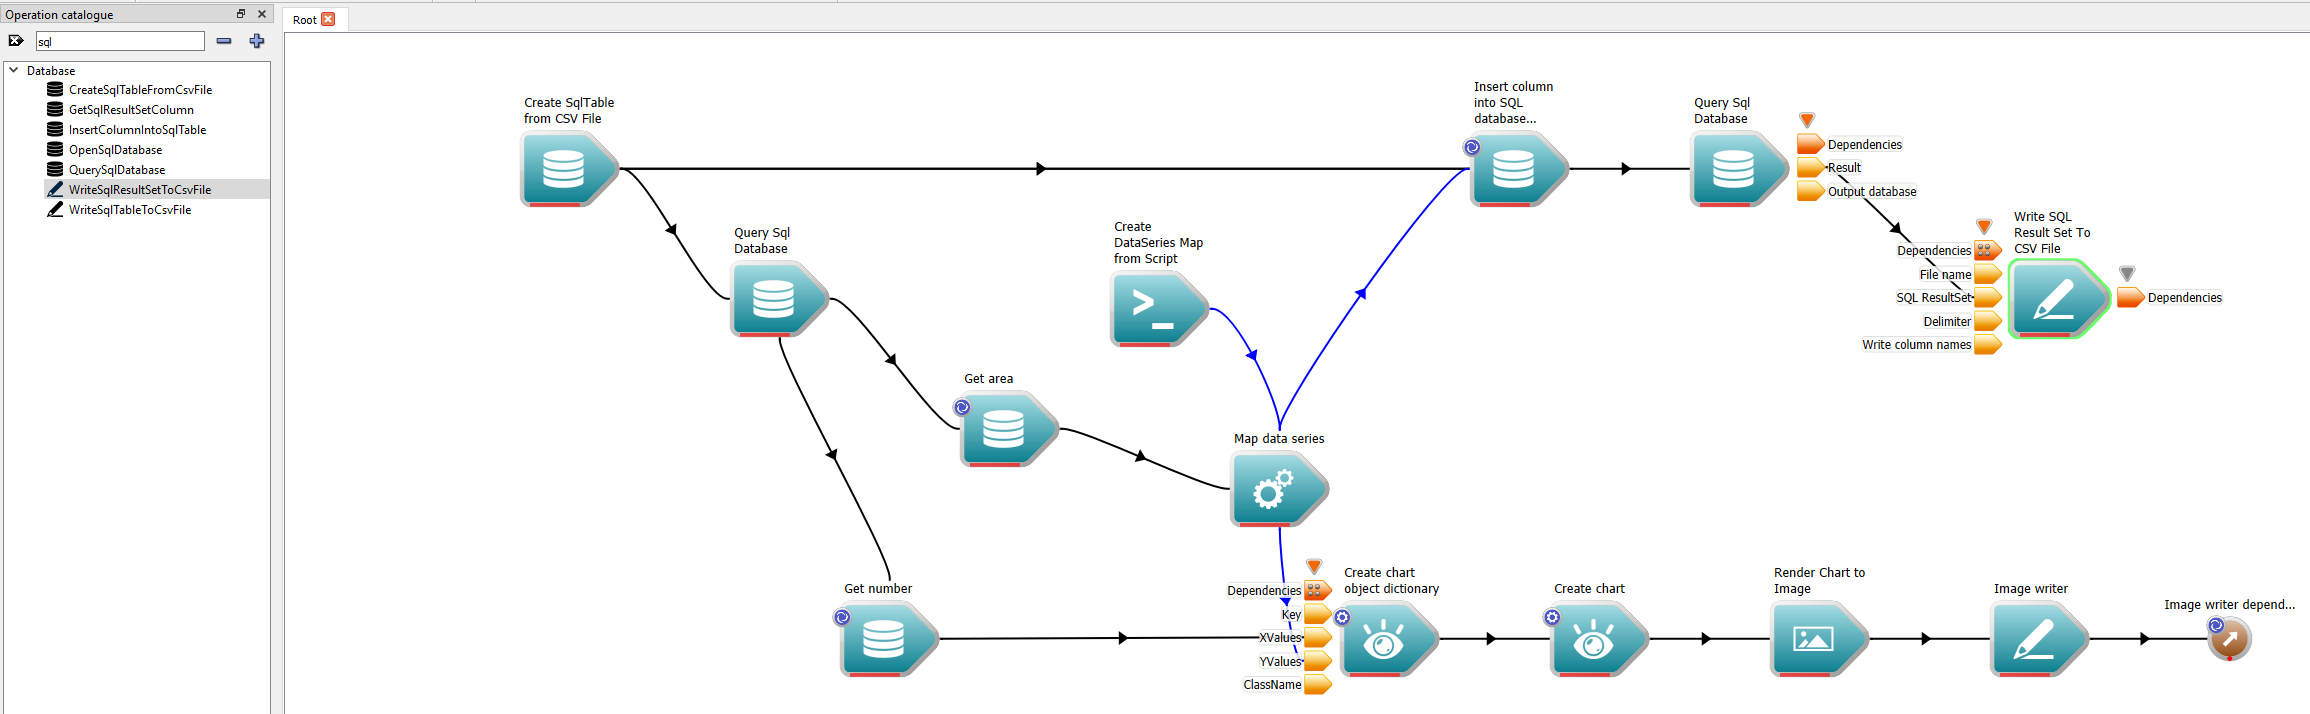
Write SQL result set to a CSV file
- Select the WriteSqlResultSetToCsvFile operation.
- In the operation editor, set the File name input to "ws:newplotsample.csv"
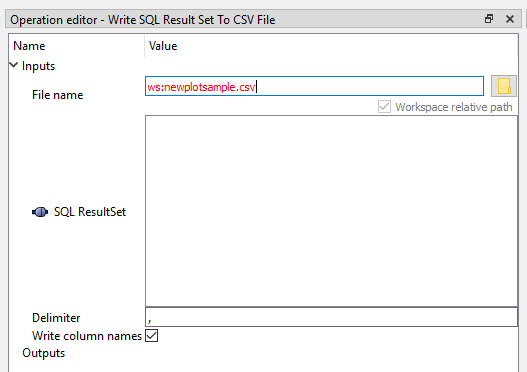
Set the file name for new CSV file
- Finally, create a WorkspaceOutput operation connected to the dependency output of the WriteSqlResultSetToCsvFile
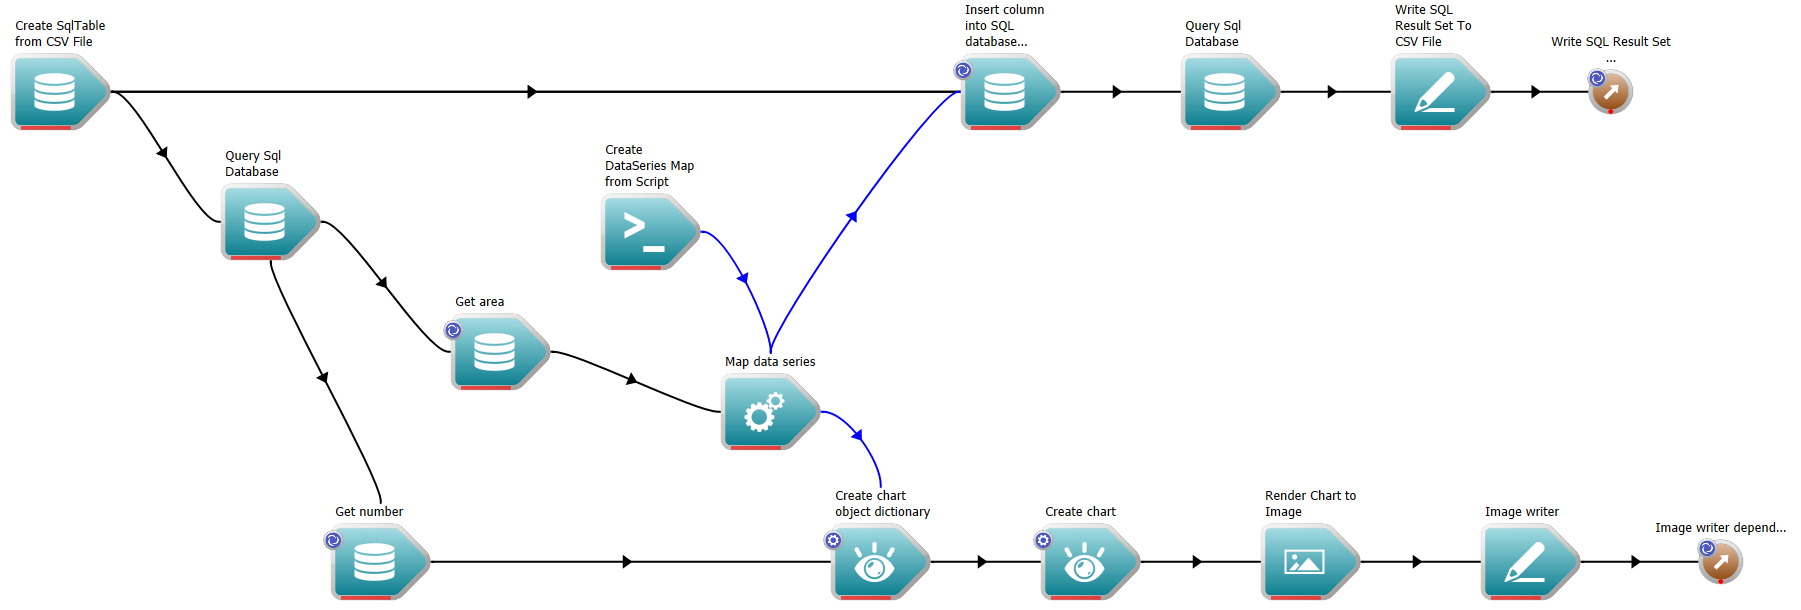
The workflow after adding our WriteSqlResultSetToCsvFile
Execute the workflow. If we look at the CSV file written out, we will see an extra column added: cumulativeAverage.
- Note
- While Workspace provides full freedom to lay out workflows in any desired manner, it's recommended to generally construct workflows in a left to right manner and to avoid crisscrossing connections where possible. By being consistent about the flow direction of your data, it helps others with readability and to track inter-operation dependencies which becomes much more important as a workflow grows in scale. Later we will cover the concept of "Nested Workspaces" which allows you to break complex workflows into a series of smaller and more manageable workflows.
Summary
This concludes the tutorial on writing and modifying data. You should now have an understanding of how Workspace can be used to:
- Read, write, modify and display data.
- Output the results to file
A complete sample workflow for this tutorial can be found here, just in case you ran into any issues along the way, or want to compare your results to others.
Next Steps
The next tutorials in this series are: