Sensitivity analysis to load estimates.
To provide an insight into the sensitivity of the marine response to the different approximations of catchment loads available to us, we have run the following scenarios:
- q3b – SOURCE Catchments (2019 version) with 2019 vegetation cover.
- q2b – SOURCE Catchments (2018 version) with 2018 vegetation cover.
- bba – BoM catchment loads from 7 rivers, otherwise q3b.
- q3M – Loads based on constant river concentrations (Miles Furnas), as presently used for the near real time model.
- q3p – SOURCE Catchments (2019 version) with pre-industrial vegetation cover
also, we ran a scenario with no river loads at all (q3O).
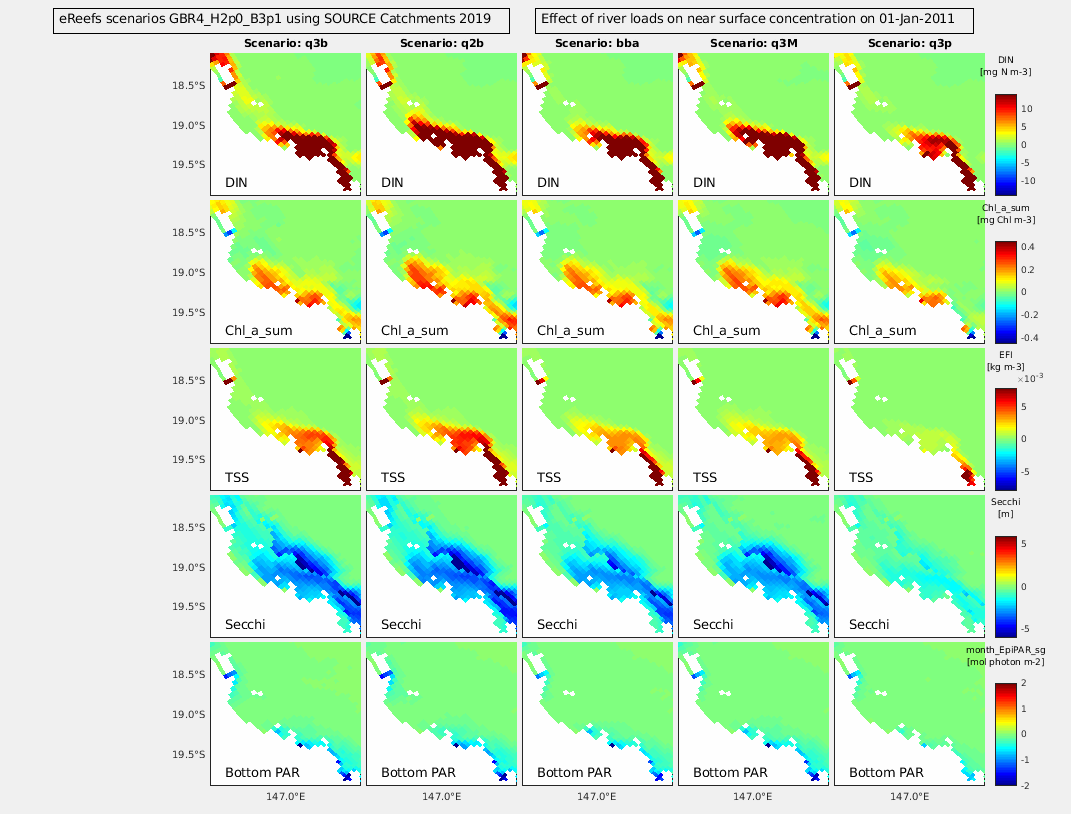
The difference between the top five scenarios and the no loads scenario quantifies the differing predictions of loads. Above is an animation (click to start in a new tab) of 5 day snapshots of the differences for surface DIN, Chla and TSS, as well as Secchi depth and bottom light.
A few comments:
- The four simulations of present day loads (q3b, q2b, bba and q3M) look similar.
- The spatial and temporal extent of the effects of rivers is almost identical, a result of the identical hydrodynamic forcing.
- The differences between the present day scenarios is less than the between each of them and the pre-industrial scenario, demonstrating the coupled catchment / ocean model to resolve anthropogenic influences, even with load uncertainties.
- The similarity of the constant loads scenarios (q3M) with the others suggests that the present near time models are reasonable approximations.
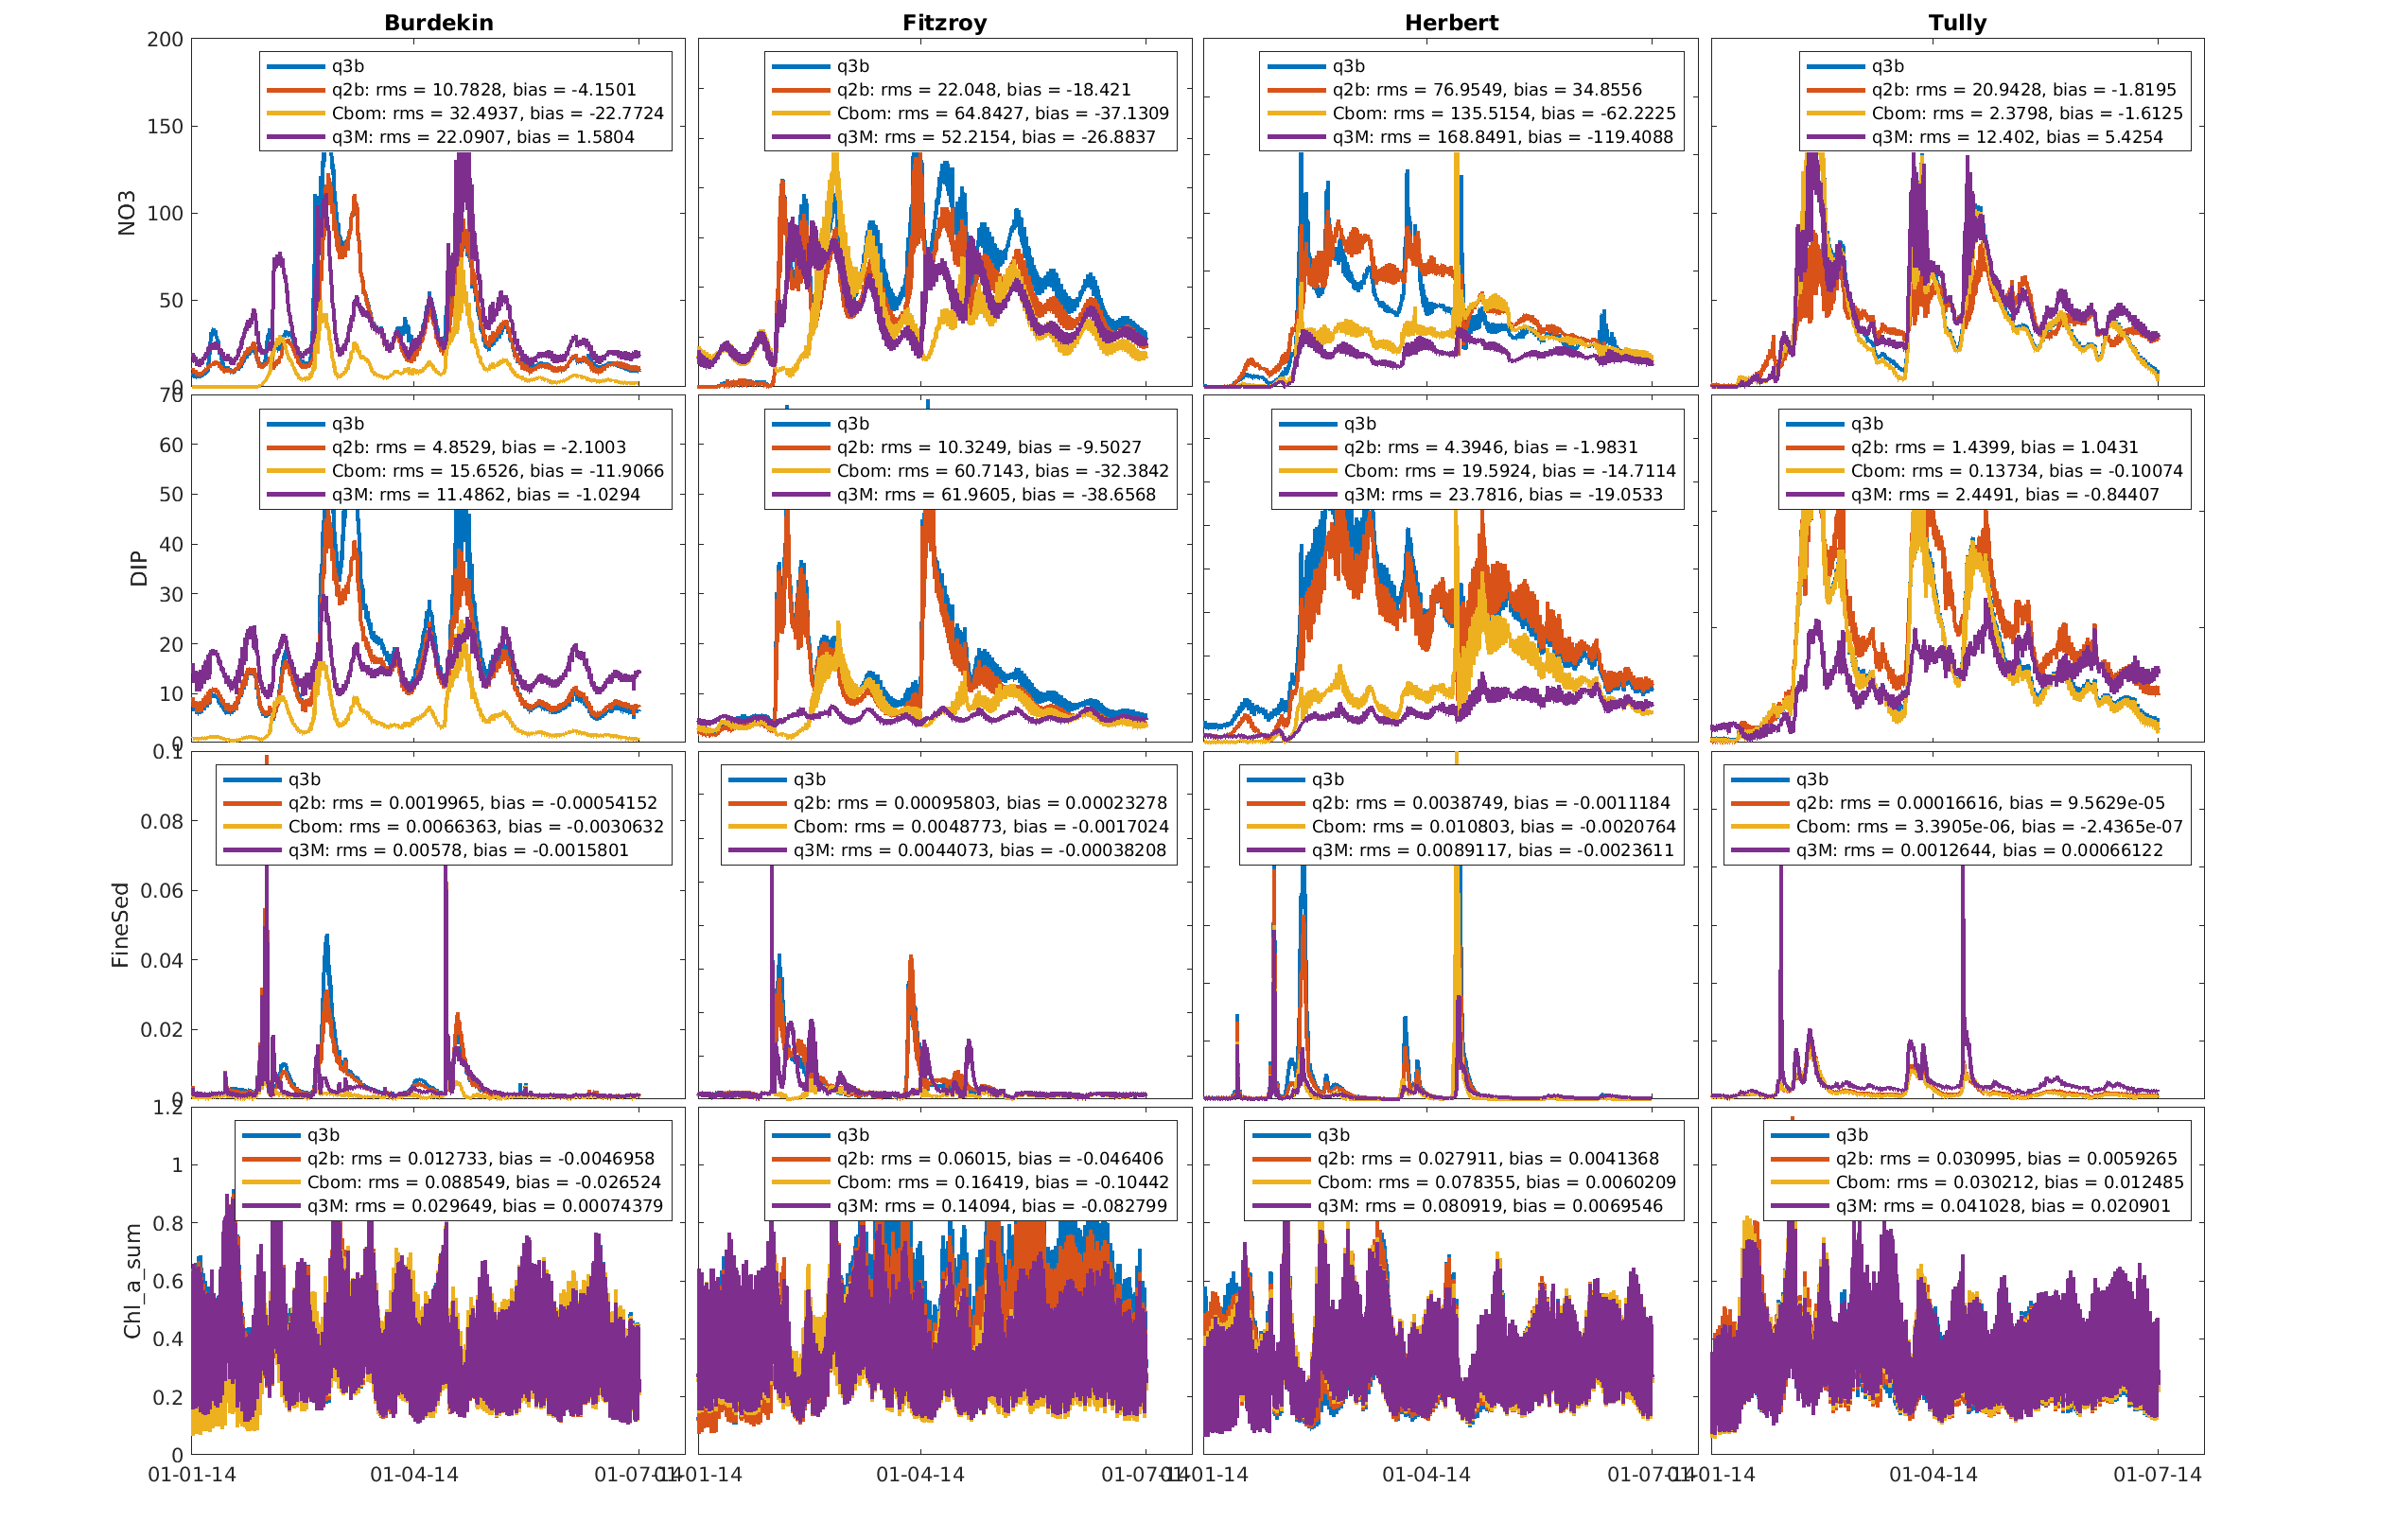
Closer examination at the river mouths shows the differences in more details:
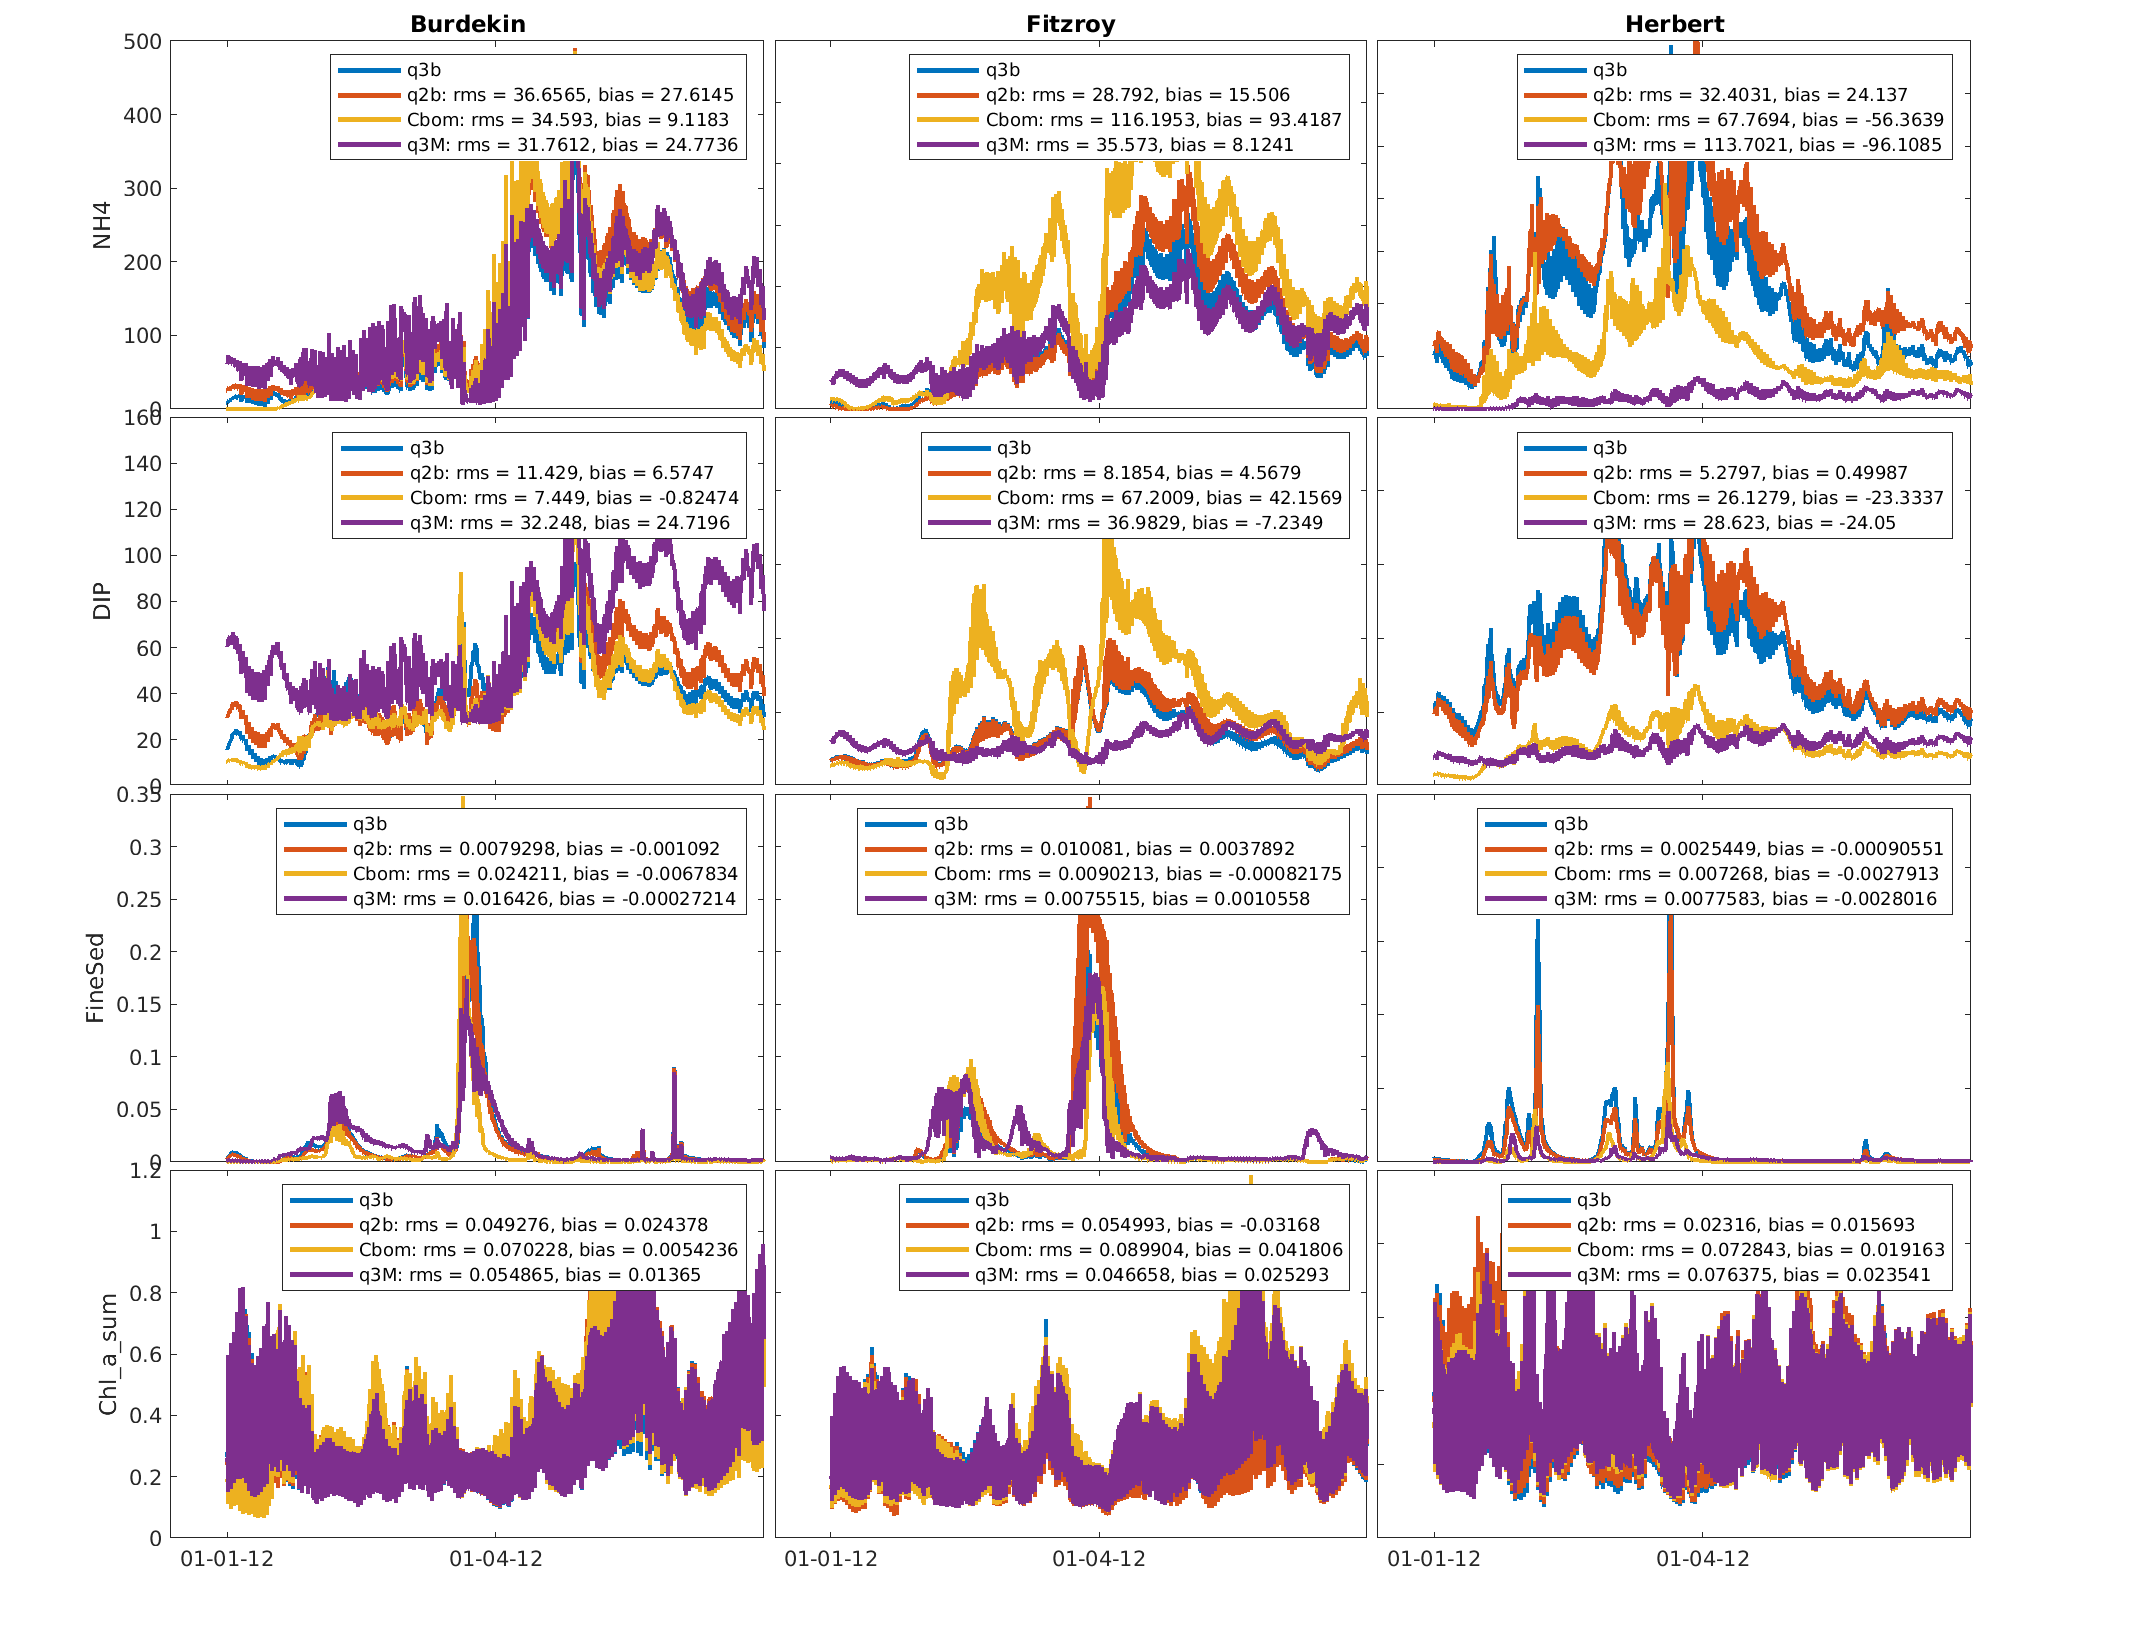
In the legend, we provide the statistical analysis of the comparison between the q2b, Cbom and q3M scenarios. At high flow the river mouths will approach the river concentrations, while at low flows they will be influenced primarily be oceanographic processes, or past discharge.
In 2014, the following occurred: