Comparison of GBR4 and GBR1 in embayments
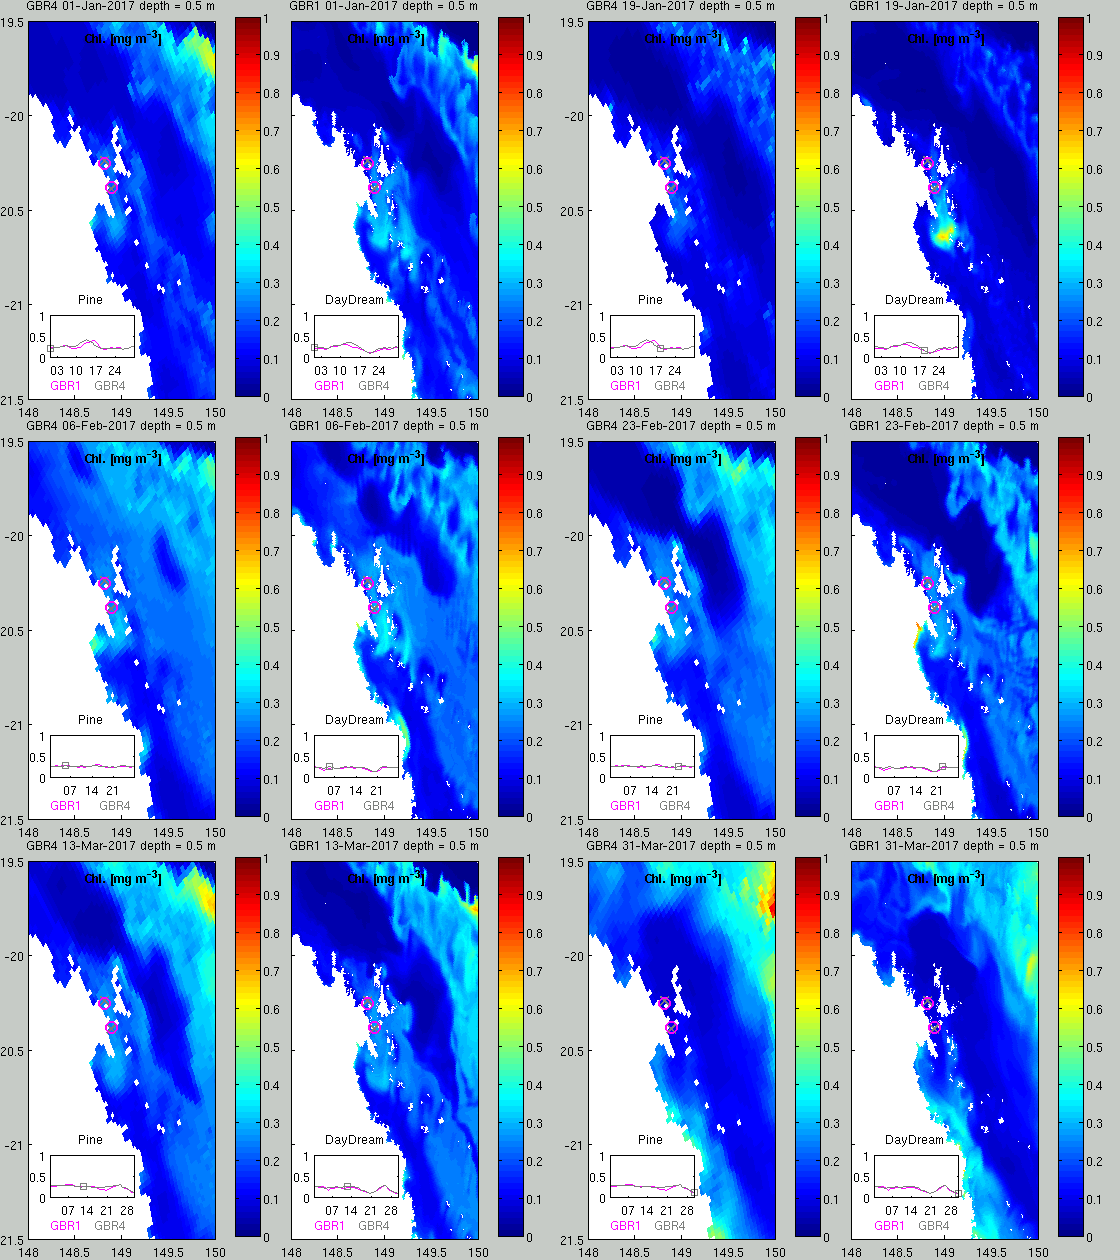
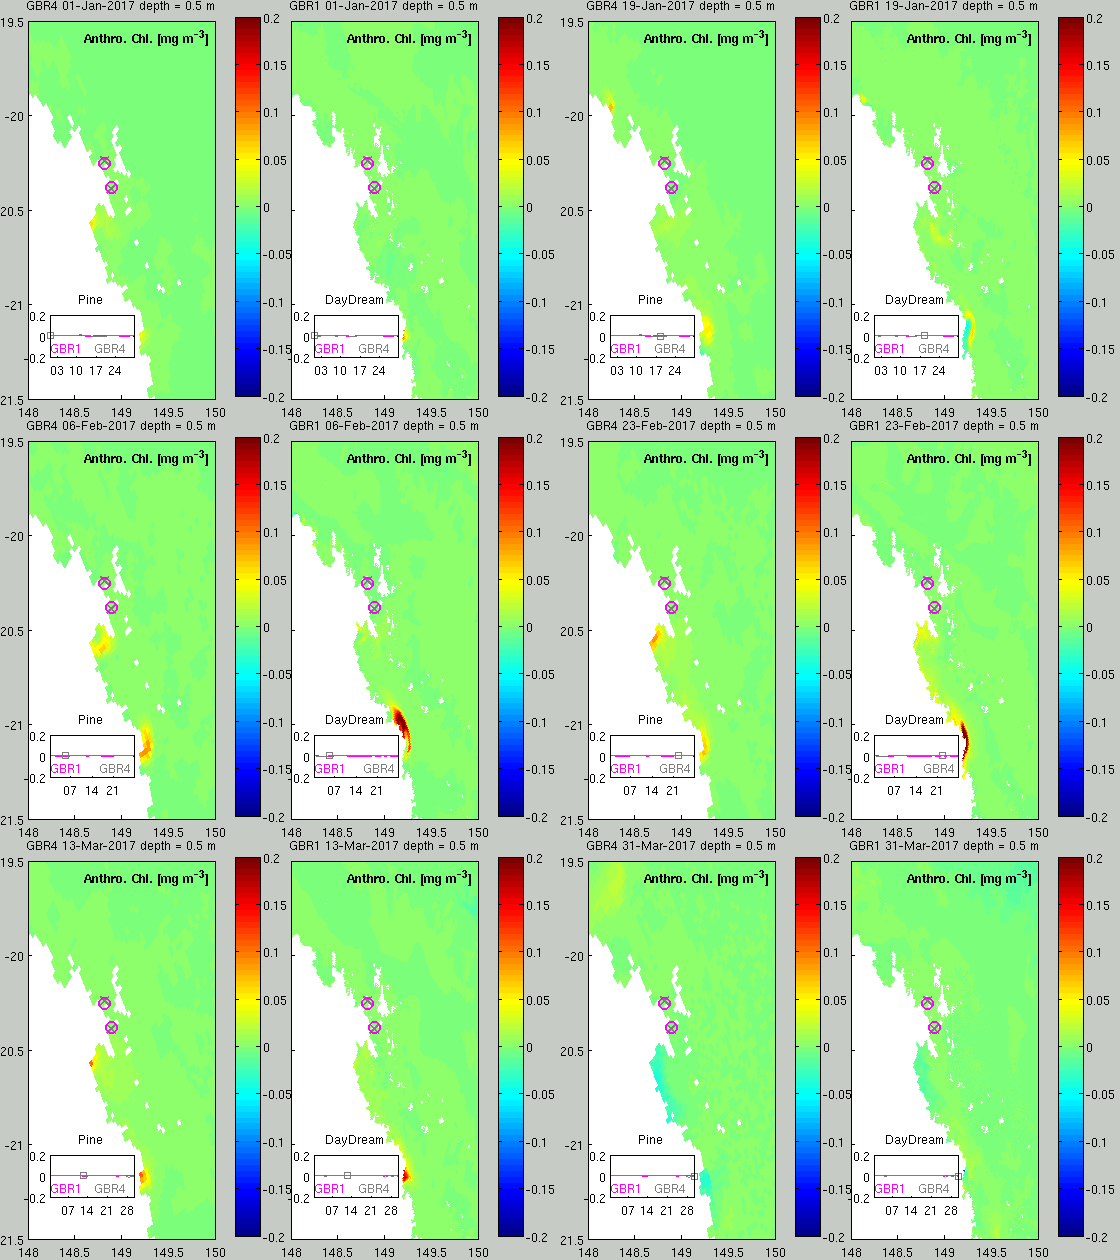
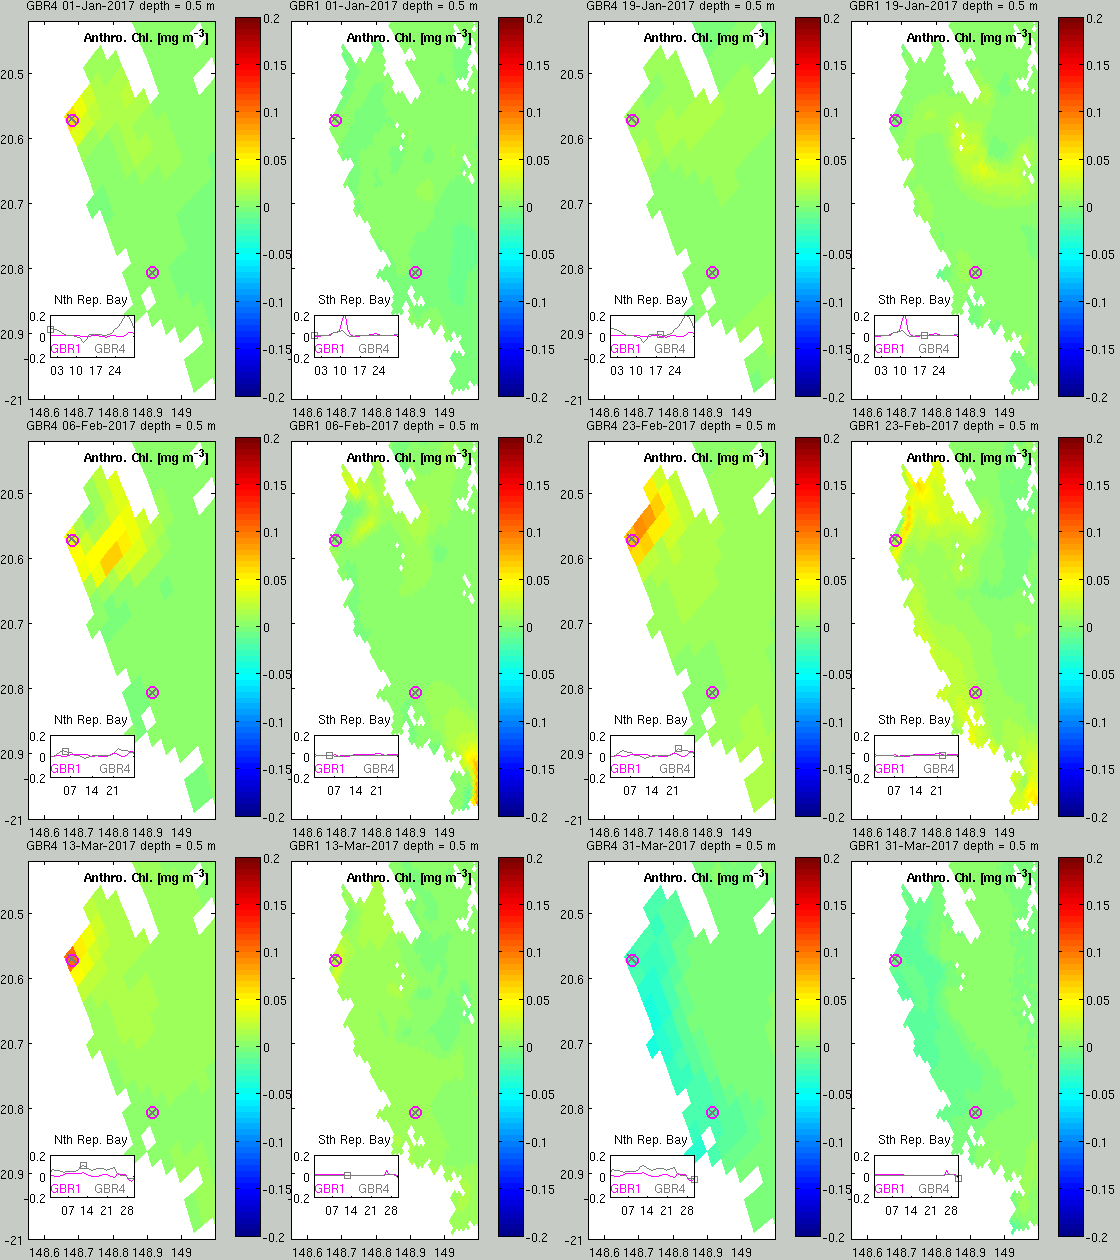
Summary. The main applications of the eReefs marine biogeochemical model have been to assess the state of the GBR waters, and to run catchment improvement scenarios. To date both these tasks have been done with the 4 km resolution model. In open ocean waters away from complex bathymetry, coastlines and river sources, processes occur at relatively large length scales, thus the 1 km resolution model behaves much like the 4 km for both estimating state and investigating catchment improvements. In coastal embayments, the 4 km model is potentially failing to resolve processes that the 1 km model captures. To investigate this, we sampled the 4 km (GBR4_H2p0_B2p0_Chyd_Dhnd, GBR4_H2p0_B2p0_CPreI_Dhnd ) and 1 km (GBR1_H2p0_B2p0_Chyd_Dhnd, GBR1_H2p0_B2p0_CPreI_Dhnd) simulations for the same time period in 5 coastal regions (Whitsundays, central GBR, Upstart Bay, Keppel Bay and Repulse Bay).
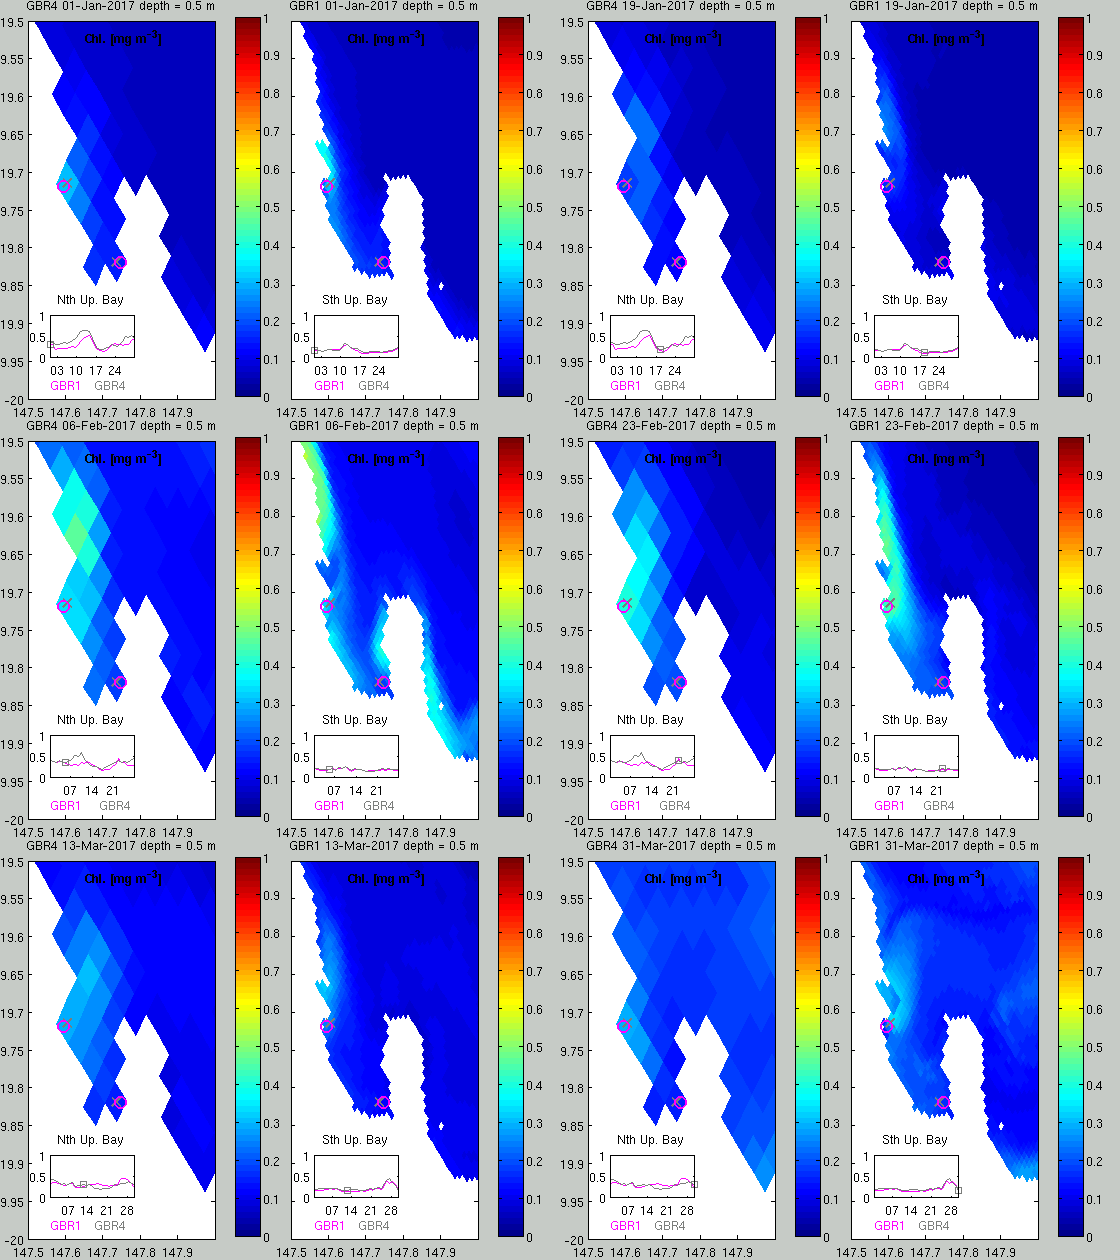
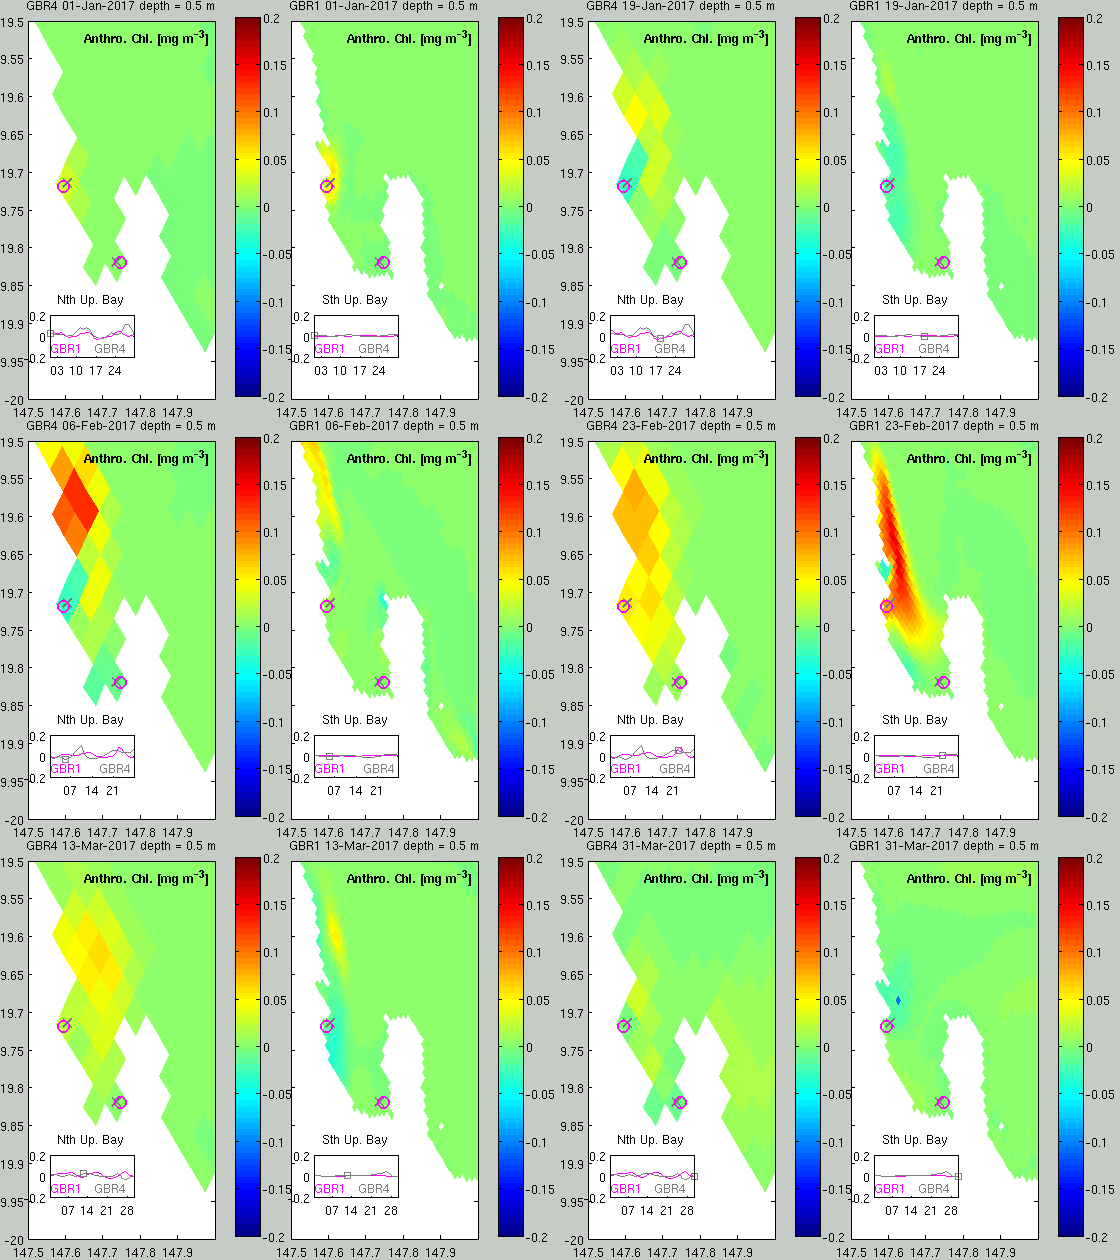
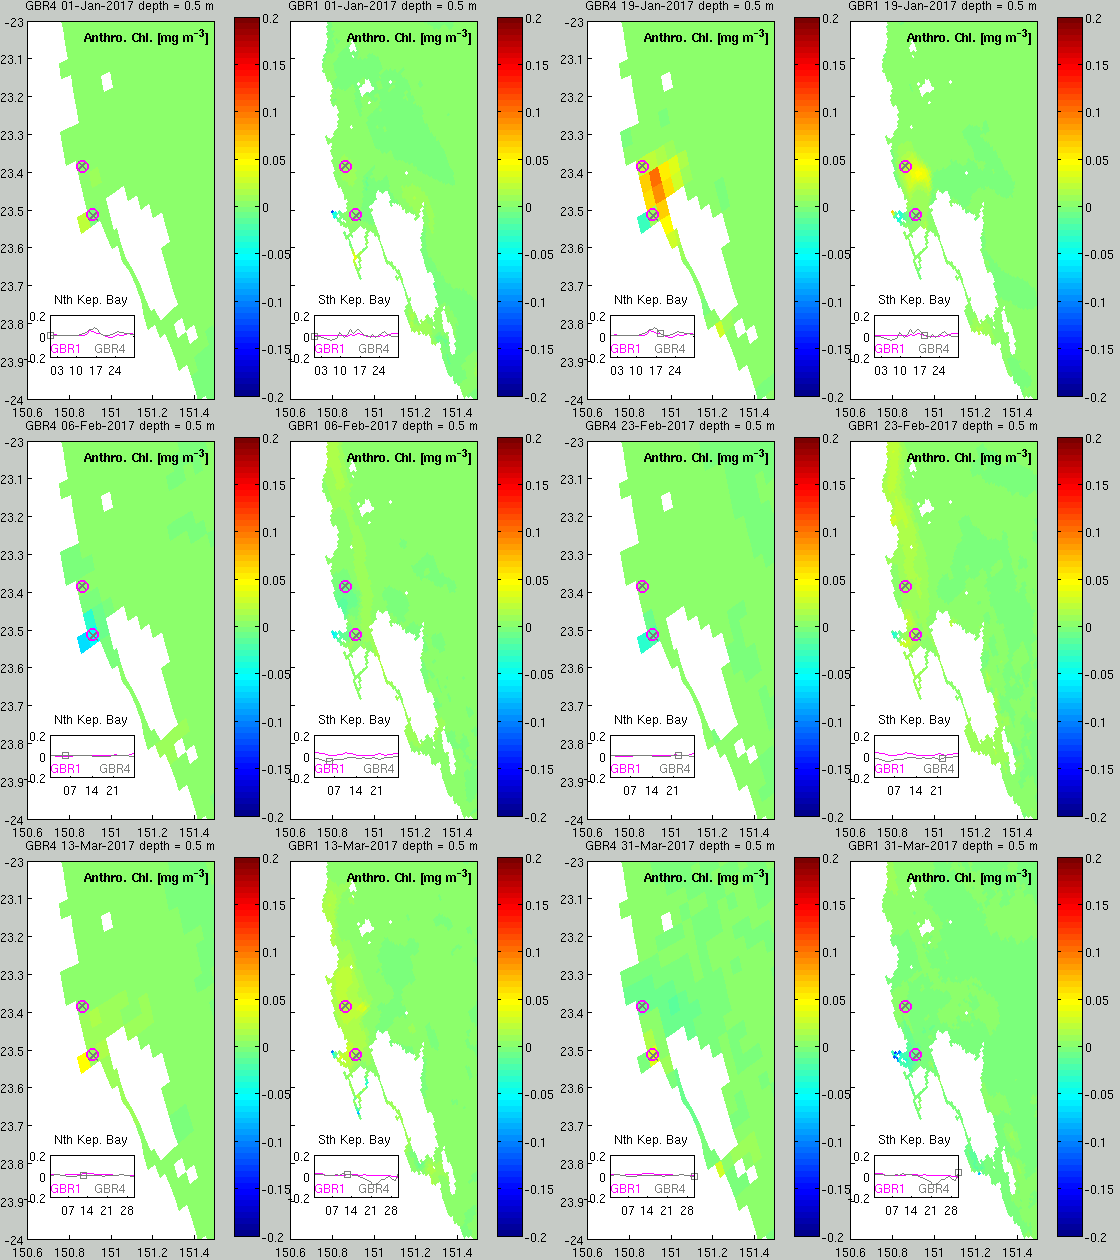
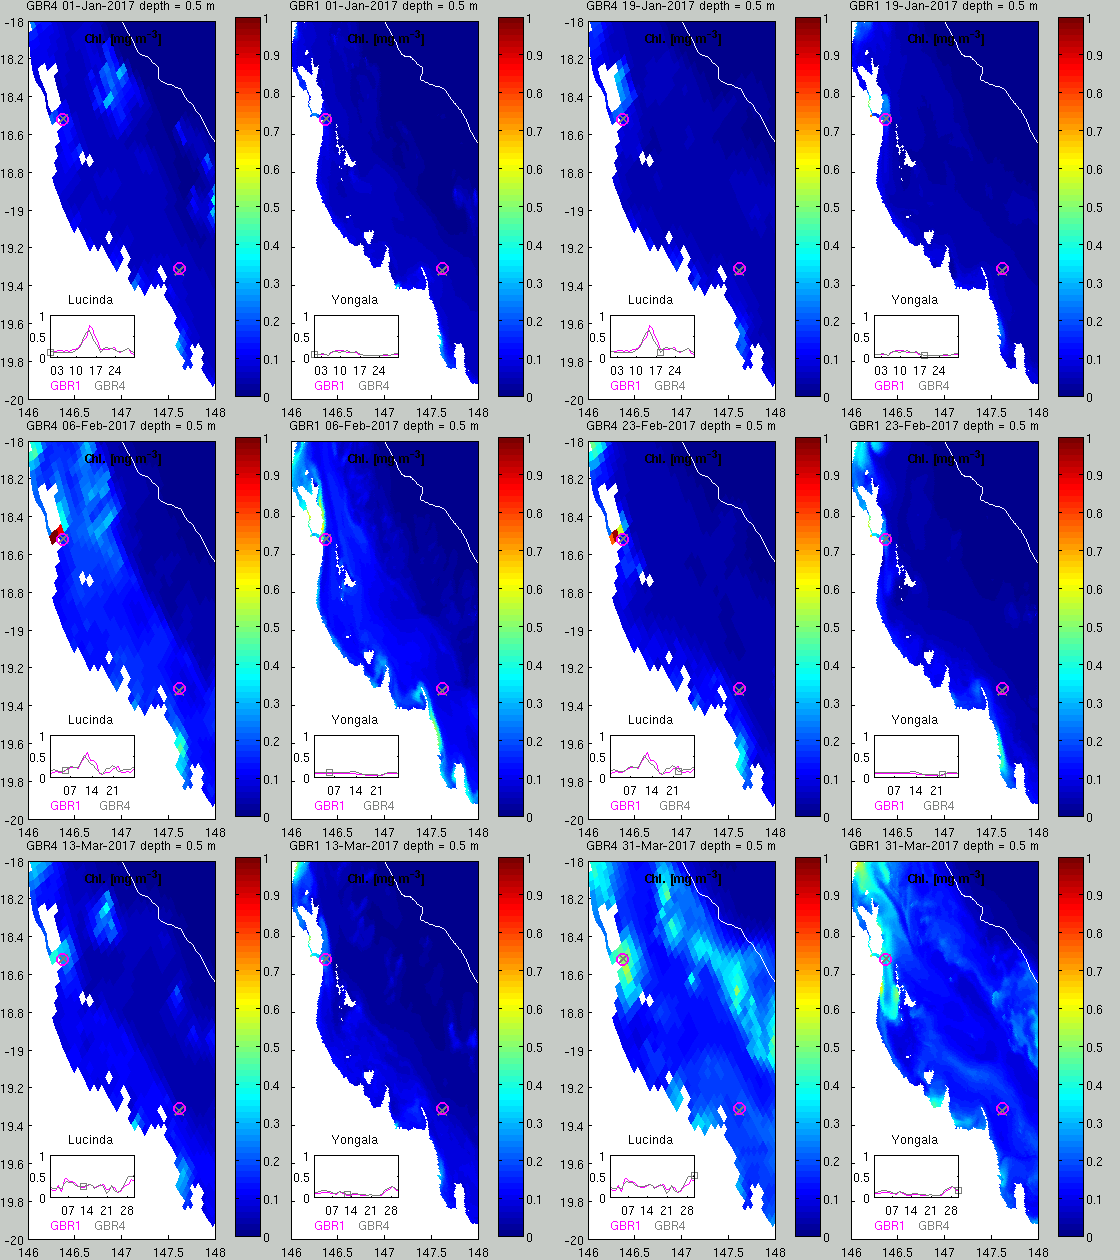
The below animations show both GBR4 (on left) and GBR1 (on right) for the first 3 months of 2017. Click on the image to play the 3 month animation. White is land. Pink lines and circles are GBR1, Grey lines and circles are GBR4. For each region we show a comparison of GBR4 and GBR1 for both chlorophyll concentration (as a measure of state) and anthropogenic chlorophyll concentration (chlorophyll in simulation forced with SOURCE catchments Baseline run – chlorophyll in simulation forced with SOURCE Catchments PreIndustrial run, as a measure of the model’s ability to resolve the effect of changing catchment condition on chlorophyll concentration).
Conclusion. For much of the GBR, GBR1 and GBR4 estimates of chlorophyll concentration and sensitivity to catchment improvements are nearly identical. Significant differences occur within river plumes (being more realistic in the 1 km) and in complex regions. The Fitzroy river plume and Keppel Bay show the greatest difference between GBR4 and GBR1, particular as a result of the improved resolution of the Fitzroy mouth in GBR1.
Animations:
Upstart Bay, with mouth of Burdekin in the northwest corner. GBR4 (left) vs GBR1 (right), chlorophyll (top), and anthopogenic chlorophyll (bottom).
Keppel Bay, with mouth of the Fitzroy in the southwest corner. GBR4 (left) vs GBR1 (right), chlorophyll (top), and anthopogenic chlorophyll (bottom).
Central GBR. GBR4 (left) vs GBR1 (right), chlorophyll (top), and anthopogenic chlorophyll (bottom).
Whitsundays. GBR4 (left) vs GBR1 (right), chlorophyll (top), and anthopogenic chlorophyll (bottom).
Repulse Bay. GBR4 (left) vs GBR1 (right), chlorophyll (top), and anthopogenic chlorophyll (bottom).
