Introduction
In the previous tutorial, we set up a basic scene, containing a simple model, a camera and a light. We then explored how to visualise the scene, and interact with it dynamically by controlling the camera.
In this tutorial, we will understand how to modify the appearance of models that we add to a scene. By the end of this tutorial, you will be able to:
There is another tutorial that will cover some other more advanced techniques for changing a models appearance and visualising state data:
A sample workflow has been provided for this tutorial.
Prerequisites
It is expected that you have already done the basic Workspace tutorials, as well as the previous tutorial, Basic 3D Visualization. This tutorial builds upon the workflow created in the last tutorial. If you did not complete the tutorial, you can start with the sample solution.
1. Attaching a shader to a model
In order to control the appearance of a MeshModelInstance, we need to attach a Shader to it. Many different shaders exist in Workspace, each of them able to modify a model's appearance in different ways. The Shader we are going to add is called a LambertShader. This Shader gives the user control over two different visual properties of the MeshModelInstance:
- Its surface color
- Its surface representation: for example, whether it is drawn as a solid object, or as a wireframe
To attach a LambertShader to our model:
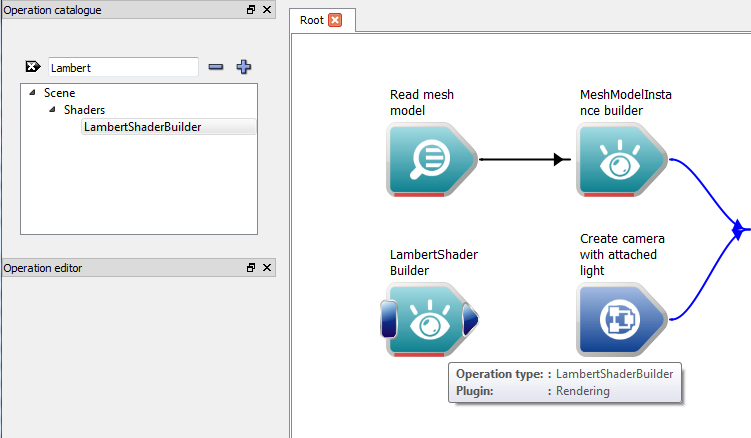
- Navigate to the
Scene section of the Operation catalogue and drag a LambertShaderBuilder onto the workspace canvas.
Creating the LambertShader
- Connect the LambertShader output of the LambertShaderBuilder to the Shader array input of the MeshModelInstanceBuilder.
- Execute the workflow - this will cause the LambertShaderBuilder to create a Shader and attach it to the MeshModelInstance.
- Note
- A single shader can be attached to multiple model instances.
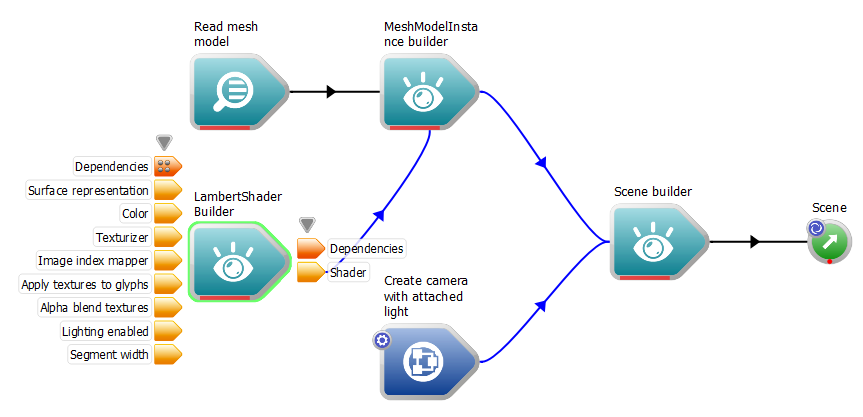
The workflow with the LambertShaderBuilder added
Now that we've created a Shader, we can start playing with the visual properties. Of course, we will also need to create a display widget for the Scene, as we did in step 2 of the first tutorial.
1.1. Changing the surface representation
There are a number of different ways which we can draw the surface of the model:
- Hidden: Hide the model from view; do not draw it.
- Bounding box: Draw only the outline of the bounding region containing the model.
- Points Only: Draw only the Nodes of the model. For models containing point-data only, selecting anything other than this representation will cause the model to be hidden.
- Wireframe: Draw the model with a wireframe representation (only the edges of elements will be rendered).
- Solid: Draw all elements in full; the mesh will appear solid.
- Solid with element edges: Draw all elements in full, and render element edges on top of the solid mesh as lines.
To change the surface representation of the model:
- Click on the LambertShaderBuilder operation to select it.
- In the properties window, change the Appearance input to Wireframe.
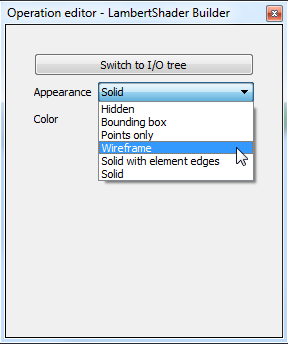
Selecting wireframe representation
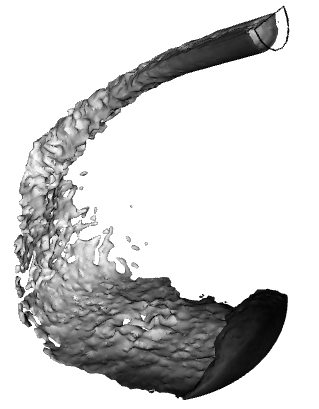
- Zoom in and observe that the image in the GLWidget has changed to draw the model with a wireframe representation.
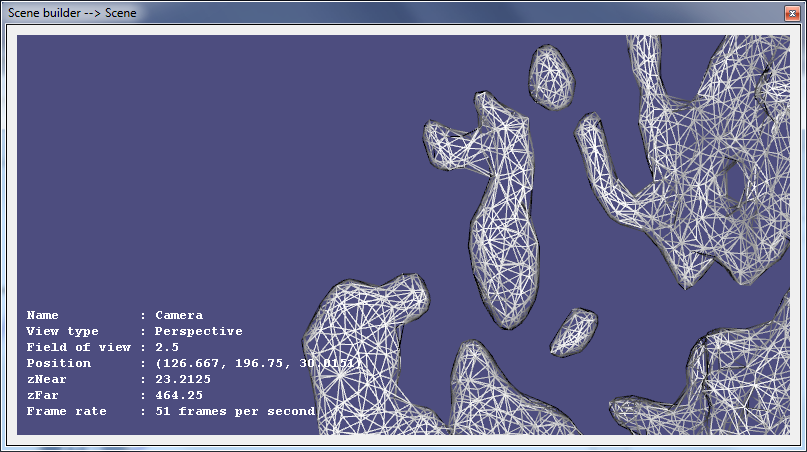
The water model displayed with a wireframe surface representation
Take some time to have a look at each of the different representations; each will be useful for different applications. For the rest of this tutorial, it is assumed that the representation is left as Solid.
1.2. Changing the color
Another modification that can be made to the surface of a mesh is its color.
- Click on the LambertShaderBuilder to select it.
- Click on the color button next to the Color input. This will create a color selection dialog.
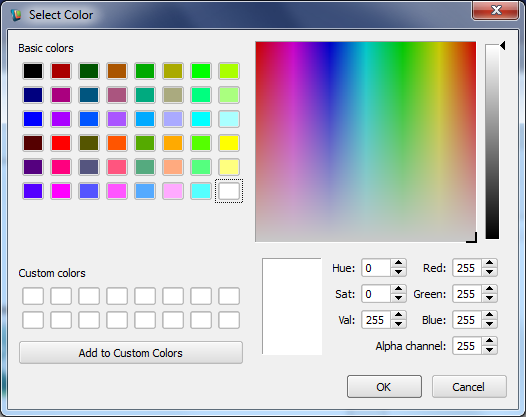
Selecting the color
- Choose the required color, in this case Red. Note that as you select the color, the model will be dynamically updated in the WSGLWidget.
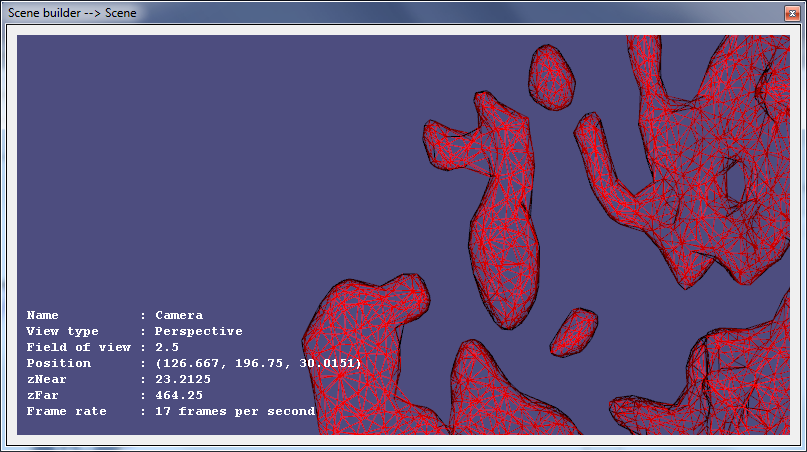
The water model is now colored red
- Now zoom out using autofit (if you have not done so already)
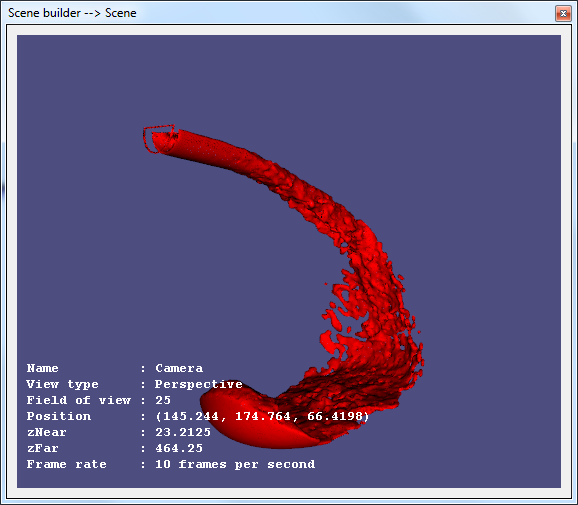
The water model zoomed out
1.2.1. Using transparent colors
In the color selection dialog, there is an alpha component at the bottom of the dialog. This can be used to control the transparency of the model. Increase and decrease the value
to make the model more or less transparent.
Depending upon the size of the model being viewed, selecting a transparent color may have a system performance penalty.
1.3. Edge break (seam) identification
Depending upon the model being visualised, the mesh data may not always appear as expected. In some cases, there are certain edges on a model which the user may expect to be drawn as hard edges, but when rendered by Workspace, are smoothed over. The two images below provide some examples:
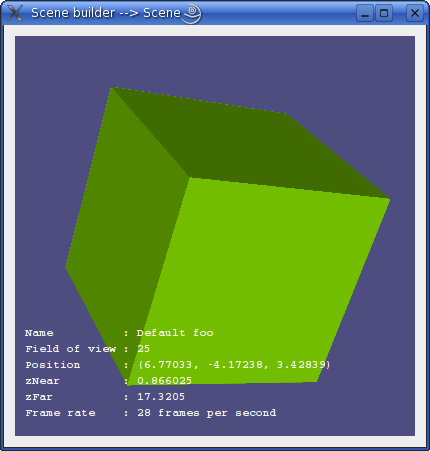
Expected representation of model with hard edges
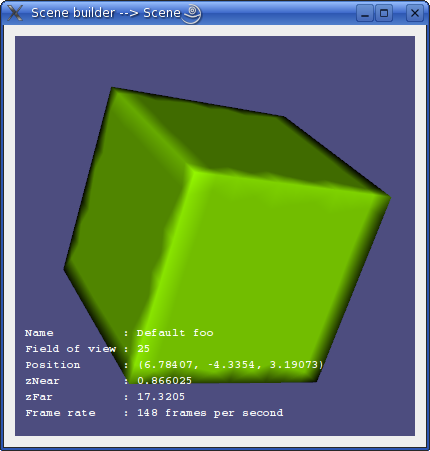
Actual cube appearance - note the rounded edges
In most cases, the person producing the model (artist or engineer) is responsible for explicitly adding these seams However, in some cases, it may be possible to shortcut this process by having the workflow 'auto-detect' hard edges. To do this:
- Click on the MeshModelInstanceBuilder to select it.
- In the properties window, modify the value of the Edge break threshold property. This tells Workspace to process any model to which it is applied and draw a hard edge between any pair of elements with an angle greater than the edge break threshold.
- Note
- This does not change any of the data stored in the MeshModel itself. Only the visual representation is changed.
2. Visualising state data
Some models have additional state data associated with their nodes and elements. In many cases, it may be desirable to visualise this state data in different ways to aid understanding of the data. There are two primary methods of visualising a model's state data in the workflow:
- Varying the surface color of the model using its state data
- Applying glyphs to a model's nodes. The glyphs will be transformed at each node using the state data.
Using combinations of these two techniques can produce many useful visualisations.
2.1. Coloring by node or element properties
Workspace allows us to vary the color of a model's surface relative to the state values stored at the nodes or elements of that model. For example, we could color our nodes by velocity using a black and white spectrum; the slower a node is travelling, the darker it will appear, and conversely it will appear brighter if it is travelling more quickly.
Example of a model colored by node properties
In this part of the tutorial, we are going to use the NodeColoringShader to shade our MeshModelInstance according to the velocity node state. Nodes will be drawn in the range [blue - aqua - green - yellow - red], blue being the slowest, red being the fastest, with values in between being interpolated across this range.
The following steps explain how to create and use a NodeColoringShader:
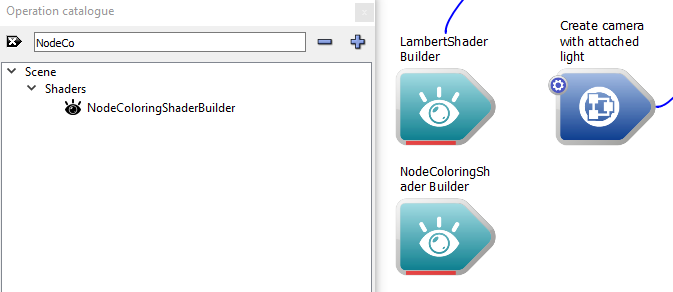
- From the
Mesh section of the OperationCatalogue, drag and drop a NodeColoringShaderBuilder operation onto the workspace canvas.
Creating the NodeColoringShader
- Click on the new shader to select it. We will see a number of properties:
- Surface representation: Identical to the surface representation property of the LambertShader
- Color scale: Controls how scalar values map to colors
- Node mapper: Controls how each node maps to a scalar value for coloring
- Enable lighting: Allows the user to disable lighting on the model so that raw colors can be seen
- Segment width: Controls the line width
To continue, we need to understand the concept of a NodeMapper. A NodeMapper is used by the NodeColoringShader to produce a scalar value for each node in the Model it is processing. Workspace provides a number of different types of NodeMappers:
- NodeStateMapper: For each node, retrieves one of its state values (e.g. velocity). This is the NodeMapper we will use.
- NodeScriptMapper: Allows the user to write a function to calculate a scalar value per-node. This function can draw on the properties of the node.
- NodeTextureMapper: Uses two or three node-states as texture coordinates to retrieve a scalar value from a scalar field or image.
To attach a NodeStateMapper to our NodeColoringShader:
- From the
Mesh section of the Operation catalogue, drag and drop a NodeStateMapperBuilder onto the workspace canvas.
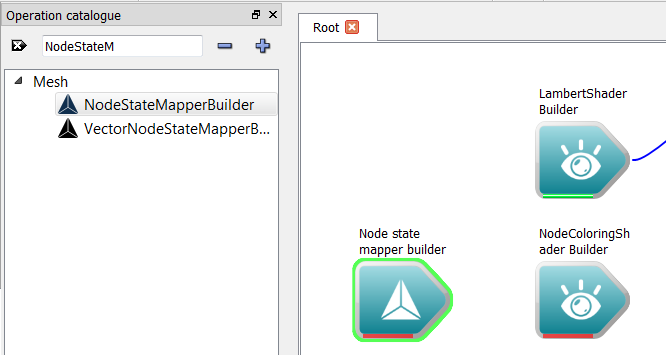
Create the NodeStateMapperBuilder operation
- Click on the NodeStateMapper and enter the text "velocityMag" into the State Name input shown in the Operattion editor dock. This tells the NodeStateMapper to map against the "velocityMag" state stored in the model.
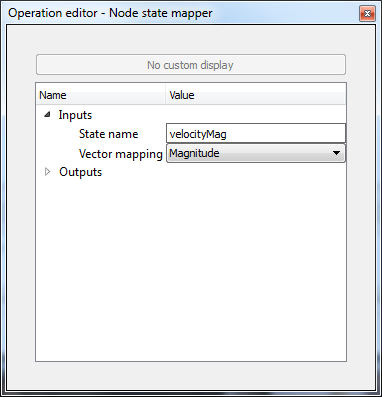
Specifying the NodeMapper's state name
Note: To get a list of the states available in a model, right click on any of the MeshModel inputs / outputs on the workflow and create the "MeshModelWidget" display widget to view the models contents. We can also dynamically retrieve the names of the states (as well as their ranges) from the model using Workspace. See the section Retrieve State Names below for more information.
- Connect the NodeStateMapper output of the NodeStateMapperBuilder operation to the NodeMapper input of the NodeColoringShaderBuilder operation.
- Note
- The VectorMapping input of the NodeStateMapper is used to map a vector state (such as velocityXYZ) to a scalar value. It allows the user to use the magnitude of the vector, or any of the x, y or z components.
The only remaining step is to connect our NodeColoringShader to the MeshModelInstance:
- Disconnect the LambertShaderBuilder from the MeshModelInstance
- Connect the NodeColoringShader output of the NodeColoringShaderBuilder to the Shader input of the MeshModelInstance operation.
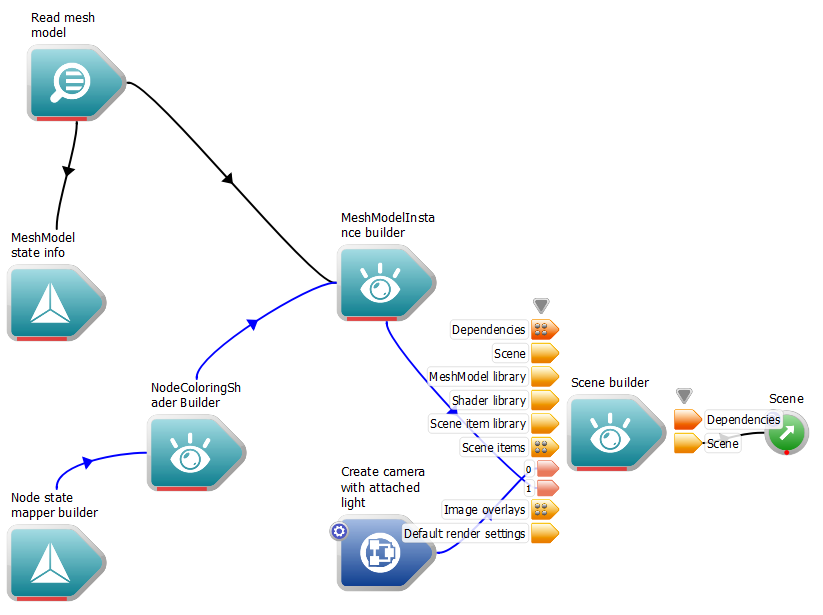
- Execute the workflow and create a WSGLWidget attached to the Scene output of the SceneBuilder operation.
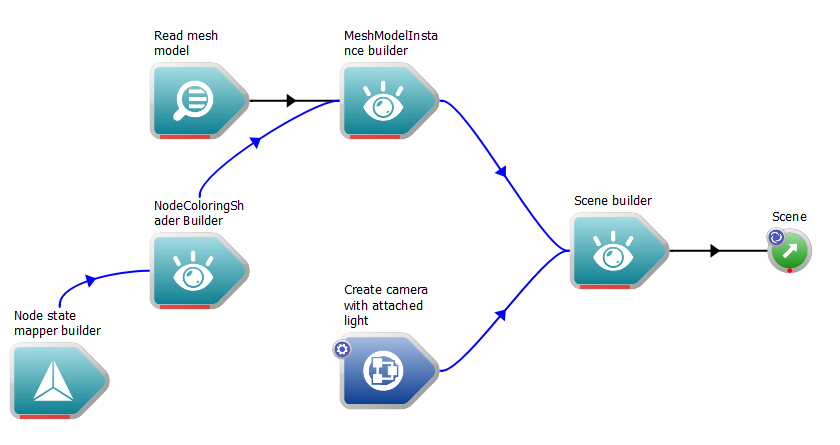
The workflow after adding the NodeMapper and NodeColoringShader
The model should now look like this:
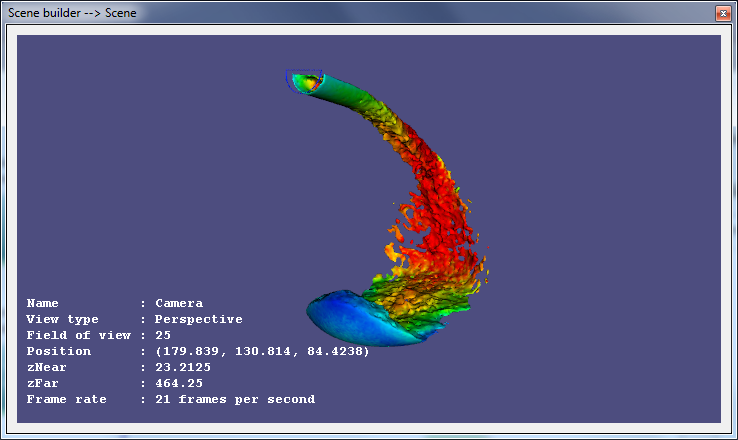
The water model colored by velocity.
Note that the default color scale appears to 'cap' the velocity shown - anything higher than 1.0 on the velocity scale is rendered with the same shade of red. The next section explains how to create an alternative color scale to more appropriately represent the data.
2.1.1. Modifying the color scale
The ColorScale is the data type used to map scalar values to a color; in our case, state data obtained from a mesh. The ColorScaleBuilder operation allows us to create a new ColorScale from its components. It has quite a few inputs:
- A minimum value
- A maximum value
- A color spectrum, i.e. the set of colors which represent values between minimum and maximum
- A number of other inputs to control how the color scale image itself appears, such as a title, a length, font information and an orientation (horizontal or vertical).
To change our color scale we need to create a ColorScaleBuilder operation, and connect it to our NodeColoringShaderBuilder. The following steps describe how to do this with Workspace:
- From the
DataAnalysis section in the Operation catalogue, drag a ColorScaleBuilder operation onto the workspace canvas.
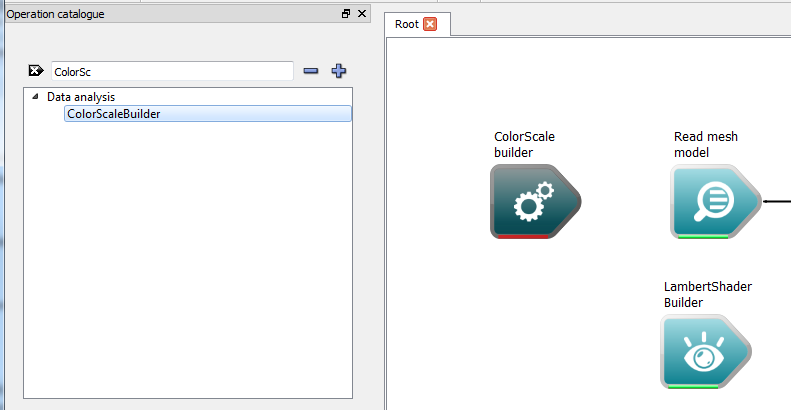
Creating the ColorScaleBuilder operation
- Connect the Color Scale output of the ColorScaleBuilder to the Color Scale input of the NodeColoringShaderBuilder.
The workflow after adding the ColorScaleBuilder
We will also change our range used by our color scale from the defaults to a minimum of 0.1 and a maximum of 0.5 (note that these values do not reflect the range of velocities stored in the model itself. The section below provides information on how to retrieve the range from the MeshModel and automatically use it to build the color scale):
- Click on the ColorScaleBuilder to select it
- In the Operation editor, modify the Minimum input to 0.1
- In the Operation editor, modify the Maximum input to 0.5
The WSGLWidget will now look like this:
The water model colored by velocity in the range [0.1, 0.5]
Note that the quantity of Red on the model has now significantly increased. This is because our modified range is causing the NodeColoringShader to represent velocities equal to or above 0.5 as the same shade of red (the highest color in the spectrum).
Now we are going to modify the color spectrum by adding a new color which is "faster" than red for our velocity. To do this:
- Click on the ColorScaleBuilder to select it
- In the Operation editor, click on the notebook button associated with the Spectrum input. This will create a color spectrum editor dialog.
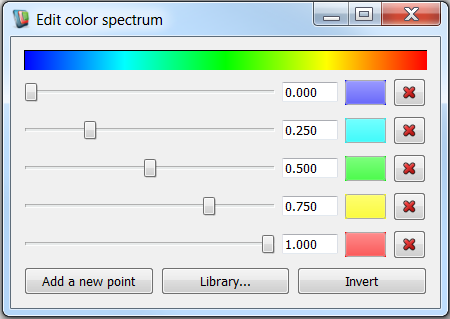
The color spectrum dialog
- Click on the 'Add a new point' button.
- Click on the color button on the right hand side of the newly added point, and select bright pink as the color.
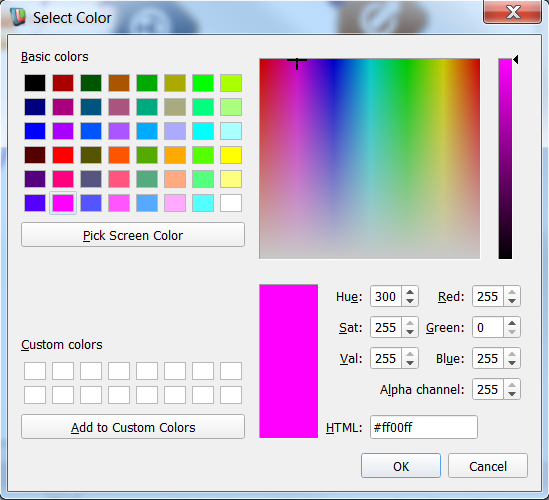
Selecting the color of the new color spectrum point
- Modify the slider bars for each color in the spectrum as follows:
- Dark Blue: 0.0
- Aqua: 0.2
- Green: 0.4
- Yellow: 0.6
- Red: 0.8
- Pink: 1.0
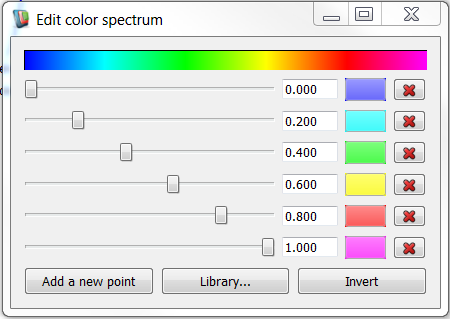
Updating the color spectrum
- Close the dialog. The MeshModel should now look like this:
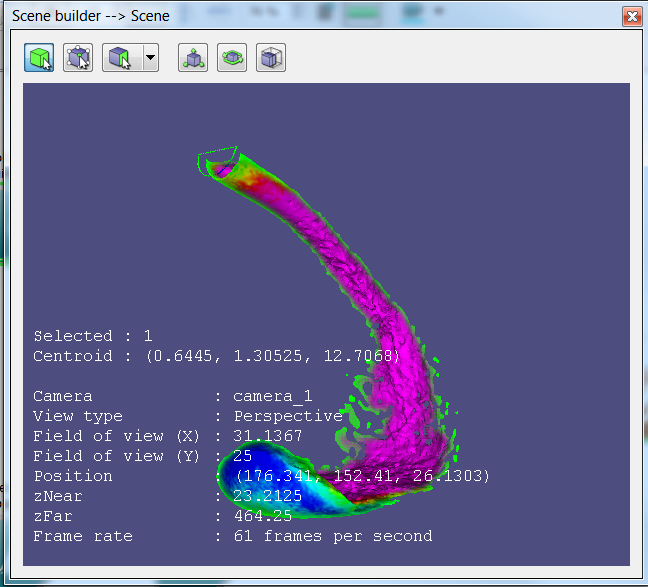
The water model colored by velocity in the range [0.1, 0.5] with a modified color spectrum
We have now modified our color scale. The next step is to display the scale itself as part of our scene.
2.1.2. Displaying the color scale in the scene
When coloring a model based on its state data, the user will often need to see which colors correspond to which state values. This requires rendering the color scale itself as a SceneOverlay. We can use our color scale image as a SceneOverlay in the workflow as follows:
- Connect the ColorScaleImage output of the ColorScaleBuilder to the Overlays input of the SceneBuilder. Workspace will automatically convert the QImage datatype to the SceneOverlay datatype.
In the WSGLWidget, the scene will now look like this:
Scene with the ColorScale image as an overlay
To change the positioning of the overlay, we need to configure the auto-conversion that the workflow performs. To do this:
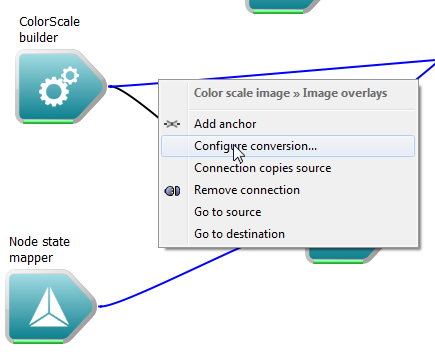
- Right click on the connection between the ColorScaleBuilder and the SceneBuilder.
- In the displayed context menu, select "Configure conversion..."
- In the displayed properties dialog, modify the Anchor property to Bottom Right, and the Offset X property to "10". This will make sure the overlay appears 10 pixels away from the bottom right corner of the WSGLWidget.
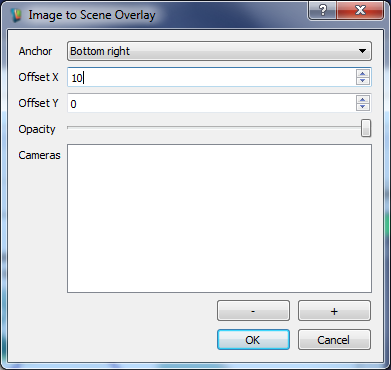
Configuring the overlay
The scene will now be drawn with a color scale in the bottom right corner, however its default size should be modified to make it more readable in this case:
- Click on the ColorScaleBuilder operation to select it.
- In the Operation editor, change the Spectrum length property to 400, and the Title property to "Velocity Magnitude". This adjusts the size and title of our color scale image.
- Click on the SceneBuilder to select it.
- In the Operation editor, change the Default Render Settings HUD font size to 8. This will make it easier to isolate the mesh.
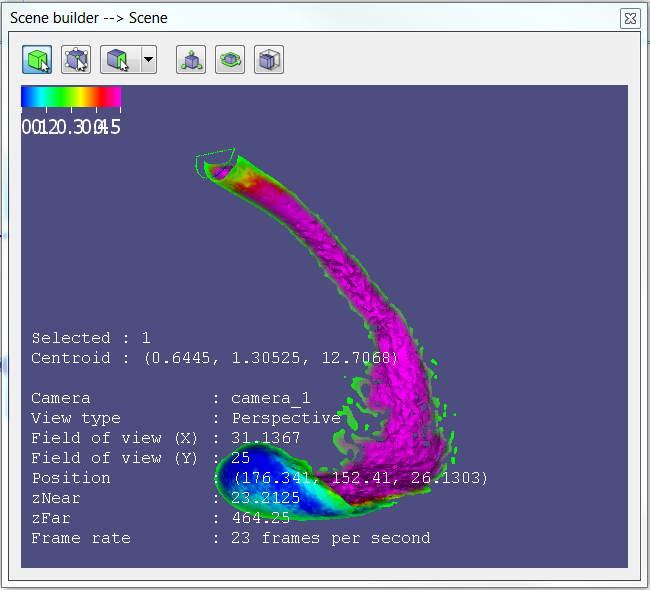
The WSGLWidget should now display an image similar to the one below:
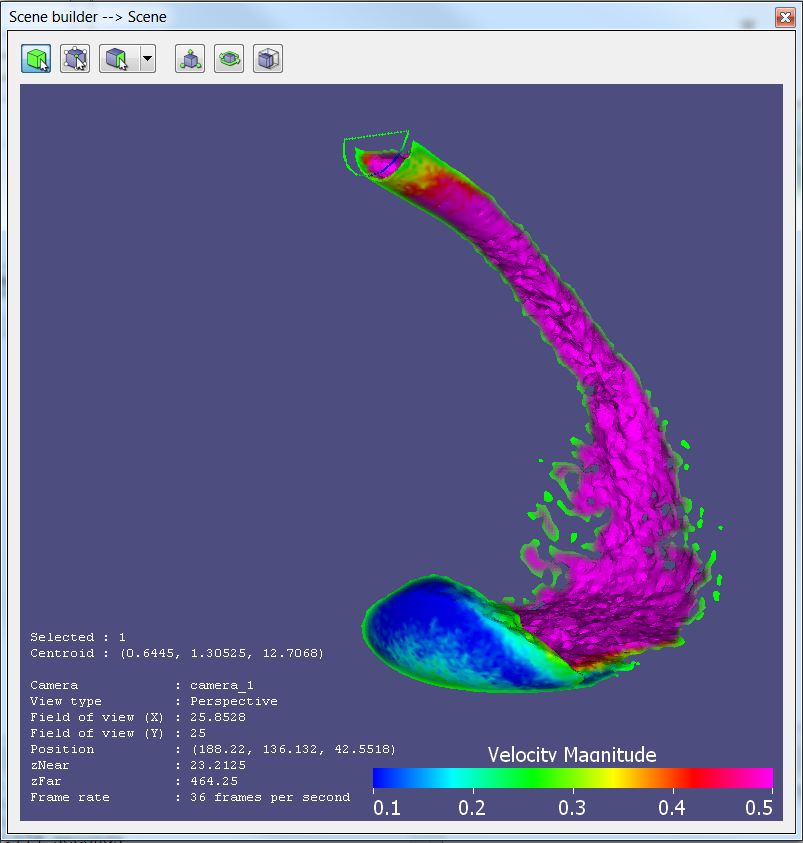
The modified scene containing a color scale image overlay
2.1.3. Retrieving a model's state names and ranges
In the last two steps, we modified our model's surface appearance to be colored by its velocity state data. In doing so, we manually entered the name of the state "velocityMag" when creating a NodeStateMapper, and manually entered the state range [0.1, 0.5] when modifying the color scale. Manually entering such inputs, although quick and easy, is not always ideal - we may not know which states exist in the model, or we might not know what the range of values are for the state we have selected.
Workspace provides a number of operations which allow us to extract this information from a model, and use it in a workflow. For our workflow, we want to achieve the following:
- Find out the names of all the states in the model, and select the one we want to color by
- Find out the range of the selected state, and use it to create our color scale
First, we will retrieve the state names:
- From the
Mesh section of the Operation Catalogue, drag a MeshModelStateInfo operation onto the workspace canvas. This operation is used to extract summary information about the state data contained in a MeshModel.
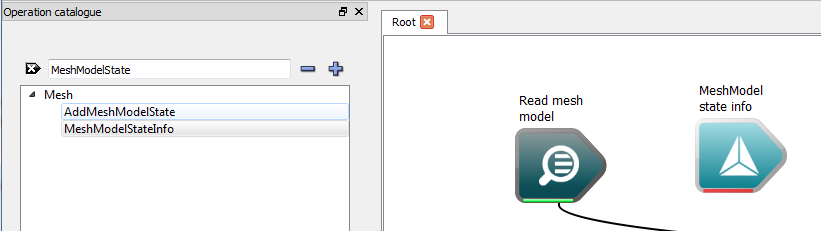
Creating the MeshModelStateInfo operation
- Connect the MeshModel output of the SelectableMeshReader operation to the MeshModel input of the MeshModelStateInfo operation. Now when we execute the workflow, the state information will be extracted from the MeshModel, provided in the form of two QStringLists - the NodeState names, and the ElementState names.
The workflow after adding the MeshModelStateInfo
Now, we need to make sure one of the states in the list is 'selected', and attached to our NodeMapper. Workspace provides a special data type for doing this; the StringSelection. A StringSelection contains a list of strings as well as an indicator of which string is selected - it is very similar to the concept underlying a ComboBox. The following steps demonstrate how to create our StringSelection:
- We need to convert our QStringList to a StringSelection. First, drag a ConvertQStringListToStringSelection operation onto the workspace canvas from the
Builtin > String section of the Operation catalogue.
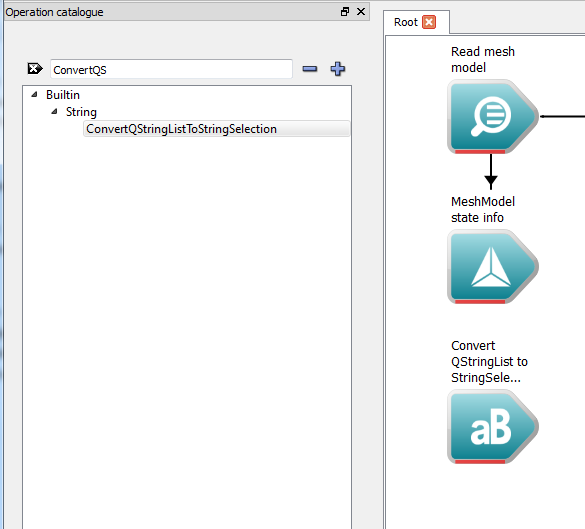
Creating the ConvertQStringListToStringSelection operation
- Connect the Node States output of the MeshModelStateInfo operation to the String List input of the ConvertQStringListToStringSelection operation.
- Now we need to make sure the workflow extracts the selected string from the StringSelection. To do this, we need to drag a StringSelectionInfo operation onto the workspace canvas from the
Builtin > String section of the Operation Catalogue. Note that through the outputs of the StringSelectionInfo operation, we have access to the number of items in the StringSelection, the index of which item is selected, as well as the selected string.
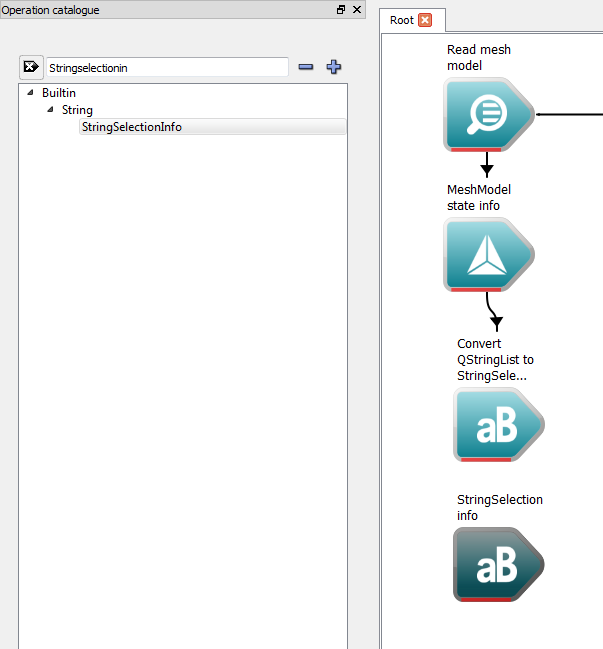
Creating the StringSelectionInfo operation
- Connect the StringSelection output of the ConvertQStringListToStringSelection operation to the StringSelection input of the StringSelectionInfo operation.
- Finally, connect the Selected String output of our StringSelectionInfo operation to the State name input of our NoteStateMapper operation. This will ensure that the selected string is used to drive the state being displayed.
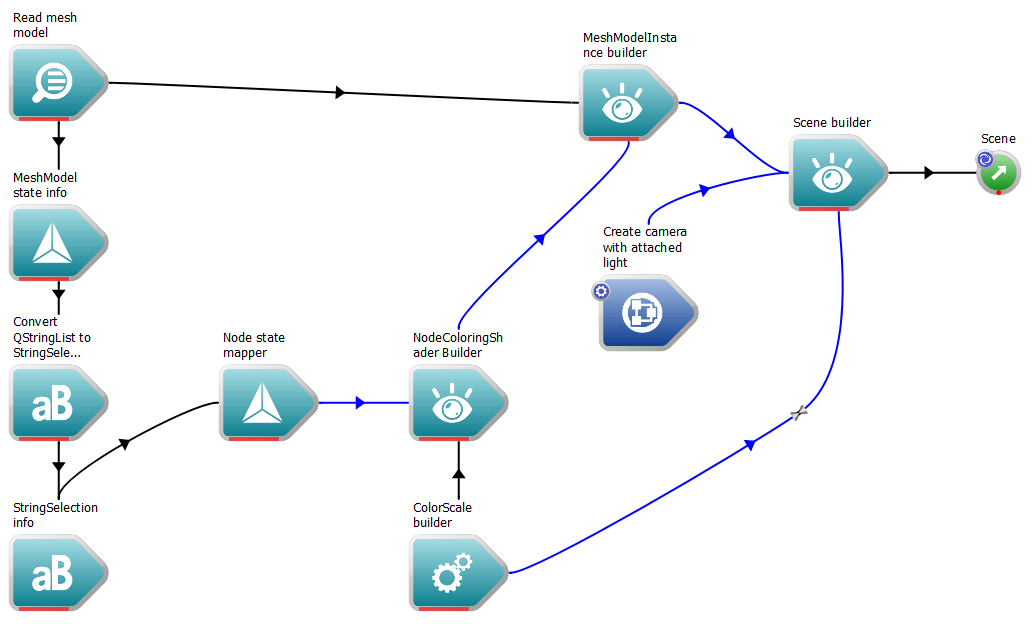
The workflow after extracting the state names
The last thing we need to do is extract the range of state values for our selected state, and use them to build our color scale. To do this:
- Drag a FindStateRange operation onto the workspace canvas from the
Mesh section of the Operation Catalogue. As its name suggests, this operation extracts the range of state values from the model for a given state.
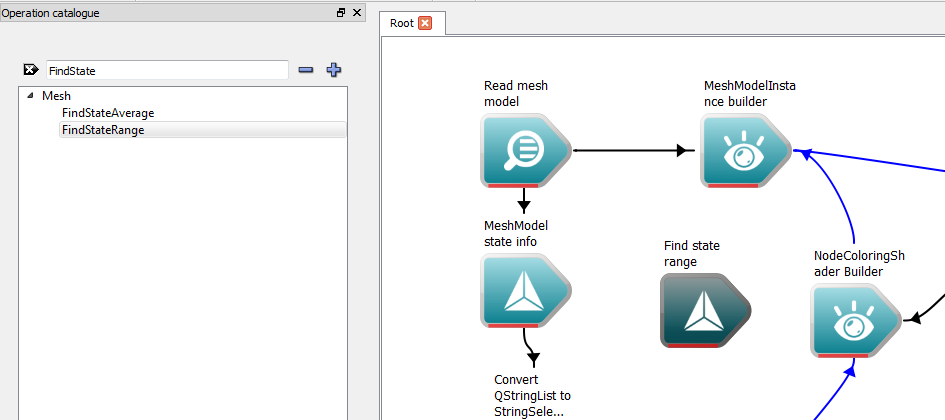
Creating the FindStateRange operation
- Connect the MeshModel output of our SelectableMeshReader operation to the MeshModel input of our new FindStateRange operation.
- Connect the Selected String output of our StringSelectionInfo operation to the State name input of the FindStateRange operation.
- Connect the Minimum and Maximum outputs of the FindStateRange operation to their counterpart inputs on the ColorScaleBuilder operation
The workflow after extracting the state range
And finally:
- Execute the workflow
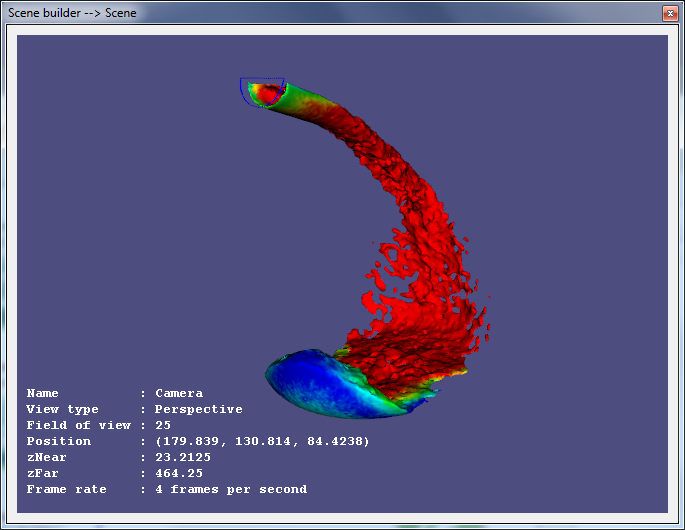
You will now see in the WSGLWidget that the color scale has its minimum and maximum values set in accordance with the min / max values provided in the Model for its velocity state.
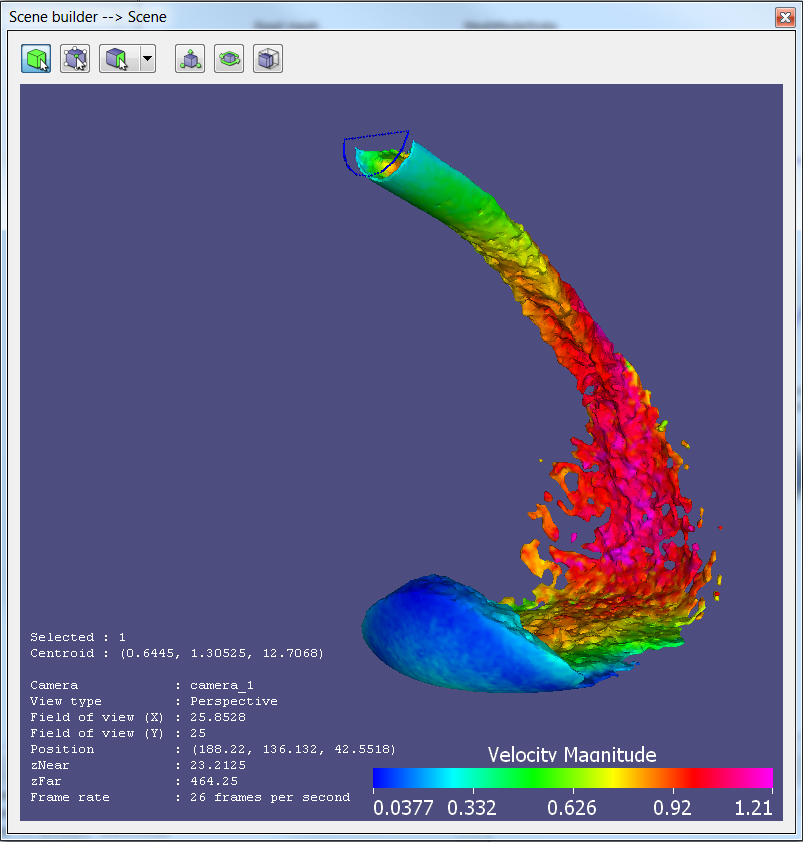
The water model; nodes colored by velocity with the state name and range extracted from the model
To change the selected state:
- Click on the StringSelectionInfo operation to select it.
- In the Operation editor, modify the selected value of the StringSelection input. Note that for our model, there is only one state available (only velocity information is contained within this model).
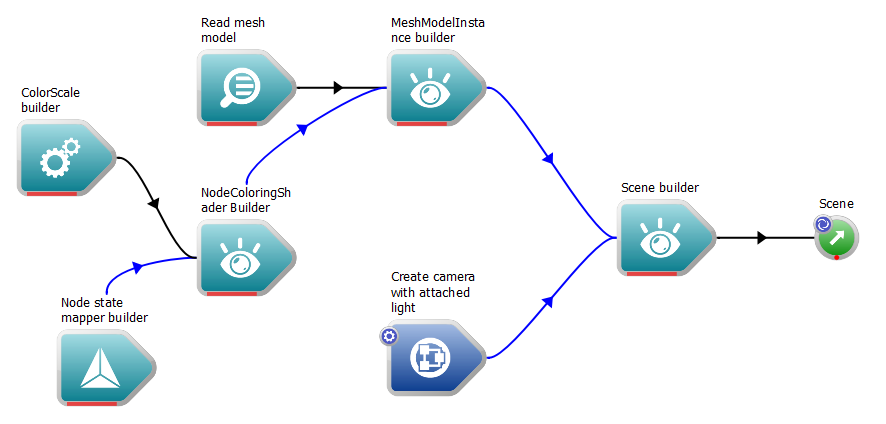
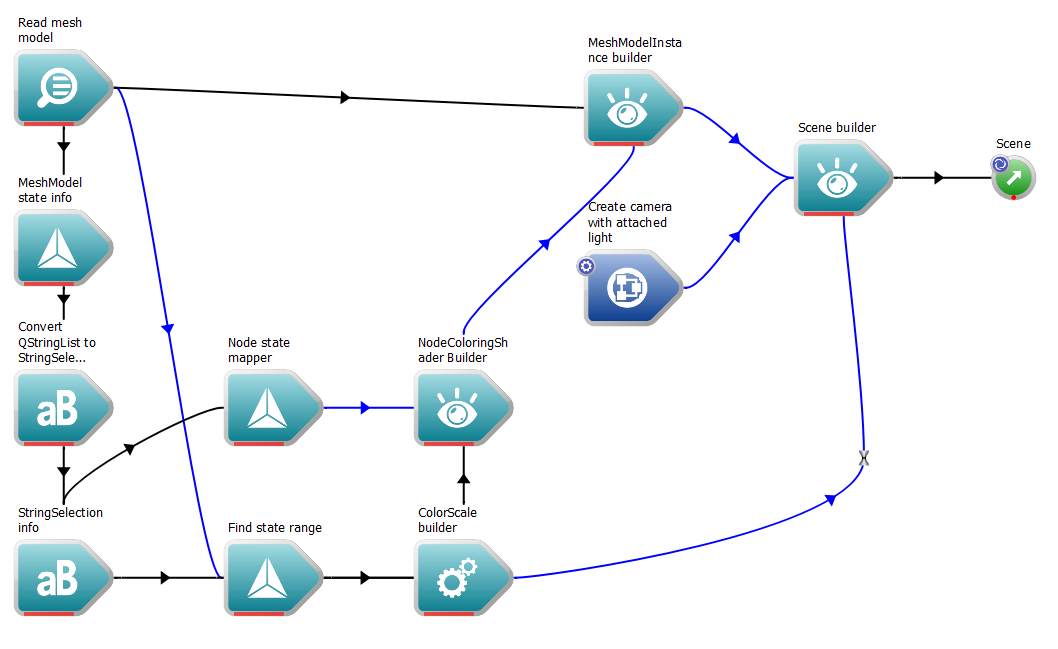
We have now learned how to extract our state data from a MeshModel, as well as how to use it to drive our visualisation. Our workflow should now look something like this:
The workflow after adding operations to color by node properties
Summary
This concludes the tutorial on modifying a MeshModel's appearance. You should now have a solid understanding of:
- How to modify a model's basic surface appearance using the LambertShader.
- How to visualise state data by coloring a model by its Node properties.
- How to create color scales to aid visualisation.
- How to use the MeshModelInfo operation to retrieve state and state-range information from a MeshModel at execution time.
Next Steps
The next few tutorials provide information about some of the other ways we can modify our visualisation workflow: