RECOM
The Relocatable Coastal Model (RECOM) is designed for non-expert modellers to generate high resolution models over limited area coastal or reef domains within the GBR, and produces hydrodynamic, sediment transport, wave and biogeochemical outputs. This package is designed for non-specialist users, whereby the user simply and intuitively interacts with the models via a graphical workflow interface.
Example RECOM application.
Fig 1. The animation shows output from Moore Reef, near Cairns, for both the RECOM configuration (the central, high resolution grid), and the GBR1 model (larger area, but obscured by the RECOM output in the centre) that provides boundary conditions for the RECOM model. The animation shows near surface (see title for layer depths in both models) temperature and velocity. The velocity arrows have been scaled such that their length represents the speed of the current, as well as the distance travelled over a time period (see legend top left). The thin black lines show depth contours from the GBR100v4 Beaman bathymetry. Additionally, inserts shows surface elevation, near-surface temperature, solar radiation at the pink symbol with the black dot over a month, 10 days and 10 days, centred on the time of the surface plot (as indicated by a pink circle with black boarder) from the RECOM model. The temperature insert shows both the RECOM (black line, pink circle) and GBR1 (grey line, pink square) temperature time-series. In this example, GBR1 model in this region is approximately 1 km resolution, while the RECOM configuration is about 110 m.
The animation shows times when the surrounding currents are strong, and the currents and temperature above the reef are similar to the upstream boundaries; and also when the currents are weaker, and reef temperatures are significantly different to those outside the reef. Look for times of high day-time solar radiation, or early morning after night time cooling, during weak currents and at low tides for the greatest difference between the reef and offshore waters.
Here is another animation of Moore Reef, this time in 2017.
And Davies Reef, in the format produced by RECOM.
Fig 2. The animation shows output from Davies Reef, near Townsville, for both the RECOM configuration (the central, high resolution grid), and the GBR1 model (larger area, but obscured by the RECOM output in the centre) that provides boundary conditions for the RECOM model. The animation shows near surface (see title for layer depths in both models) temperature and velocity. The velocity arrows have been scaled such that their length represents the speed of the current, as well as the distance travelled over a time period (see legend top left). The thin black lines show depth contours from the GBR100v4 Beaman bathymetry. Additionally, inserts shows surface elevation, near-surface temperature and incoming solar radiation at the pink symbol with the black dot over a month, 10 days and 10 days respectively, centred on the time of the surface plot (as indicated by a pink circle with black boarder) from the RECOM model. The temperature insert shows both the RECOM (black line, pink circle) and GBR1 (grey line, pink square) temperature time-series. Finally, above the surface elevation panel is a schematic of the Moon phase, depicting the phase of the moon at the time of the plot and showing the transition through a lunar month from New Moon (spring tides) to First Quarter (neap) to Full Moon (spring) to Third Quarter (neap) and returning to the New Moon. In this example, GBR1 model in this region is approximately 1 km resolution, while the RECOM configuration is about 200 m.
Arlington Reef.
Opal Reef.
Fitzroy Island Reef.
John Brewer Reef

If you are interested in becoming a RECOM user or finding out more, please contact us.
The front page of the user interface for RECOM
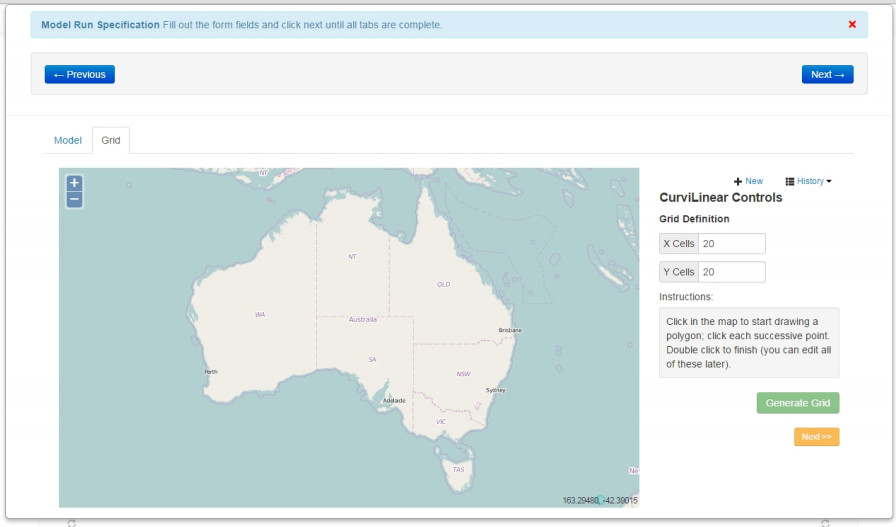
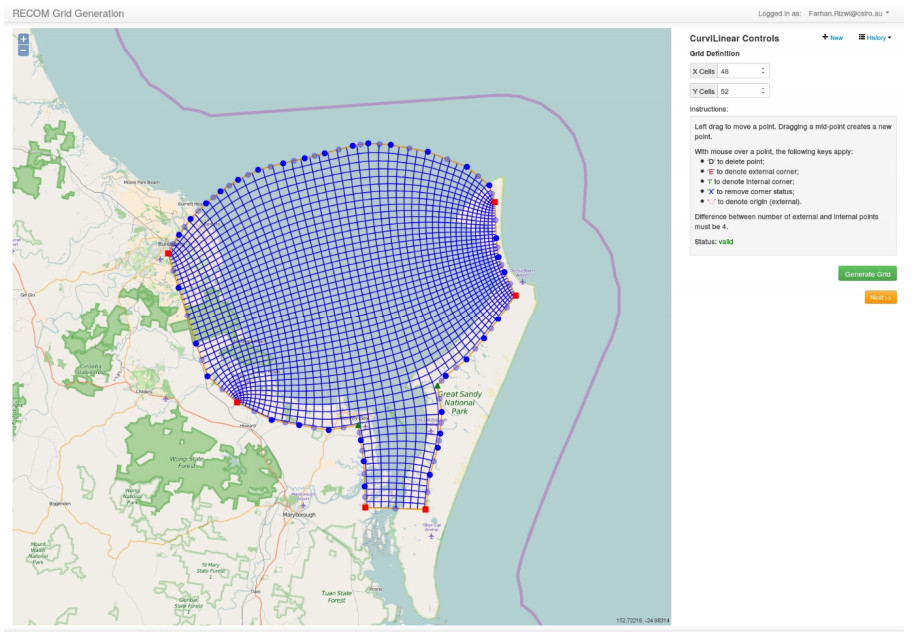
The user then chooses a domain and builds a grid
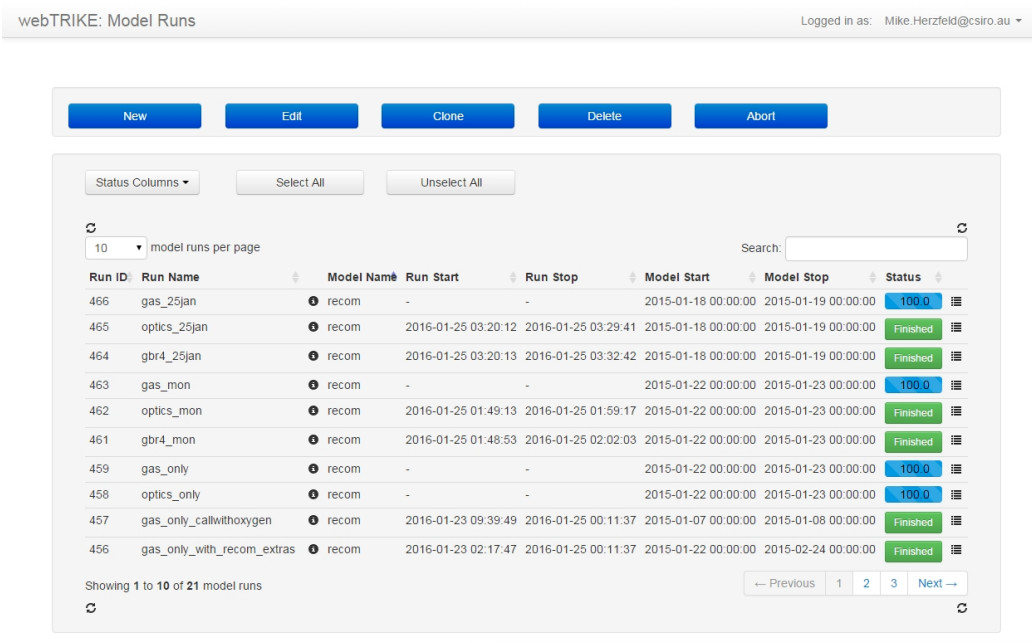
The user then runs the model and can check the status
RECOM has been applied to three test cases; the Fitzroy Estuary (for a freshwater impacted estuarine environment), Heron Island (for a reef environment) and the Whitsunday Islands (for a non-river impacted bay). Assessment of RECOM’s performance in these regions is detailed in the Marine Modelling Final Report.
RECOM has shown to be a perfect tool for non-specialists to generate a first view of the dynamics of a local region, and to effortlessly produce a solid basis for further model optimization for more experienced users.
Download the RECOM User Manual here: Download
Peer-review papers using RECOM.
Baird, M.E., M. Mongin, F. Rizwi, L. Bay, N. Cantin, L. Morris (2021) The effect of natural and anthropogenic nutrient and sediment loads on coral oxidative stress on runoff-exposed reefs. Mar. Poll. Bull. 168, 112409
Baird ME, Green R, Lowe R, Mongin M, Bougeot E (2020) Optimising cool-water injections to reduce thermal stress on coral reefs of the Great Barrier Reef. PLoS ONE 15(10): e0239978. https://doi.org/10.1371/journal.pone.0239978.
Baird, M. E., K. Wild-Allen, J. Parslow, M. Mongin, B. Robson, J. Skerratt, F. Rizwi, M. Soja-Woźniak, E. Jones, M. Herzfeld, N. Margvelashvili, J. Andrewartha, C. Langlais, M. Adams, N. Cherukuru, S. Hadley, P. Ralph, T. Schroeder, A. Steven, U. Rosebrock, L. Laiolo, M. Gustafsson, and D. Harrison (2020). CSIRO Environmental Modelling Suite (EMS): Scientific description of the optical and biogeochemical models (vB3p0). Geoscientific Model Development.13:4503-4553.
Baird, M. E., M. Mongin, F. Rizwi, L. K. Bay, N. E. Cantin, M. Soja-Wozniak and J. Skerratt (2018) A mechanistic model of coral bleaching due to temperature-mediated light-driven reactive oxygen build-up in zooxanthellae. Ecol. Model 386: 20-37.