Sediments – GBR1
Figure 1 compares the fine-resolution sediment transport 1 km model (GBR1) against the calibrated coarser-resolution GBR4 model. Both models predict similar patterns of the large-scale distribution of the suspended sediment on the shelf. The details of these distributions, however, vary across the region and through time illustrated also in the time series plots below. The peak levels of TSS simulated with GBR1 tend to exceed analogous data simulated with GBR4. The discrepancies between two models often exhibit an intermittent character – both fine and coarse resolution models appear similar except for a succession of high resuspension events predicted by the fine-resolution model. More thorough assessment of the GBR1 model requires observations concurrent with the GBR1 archive.
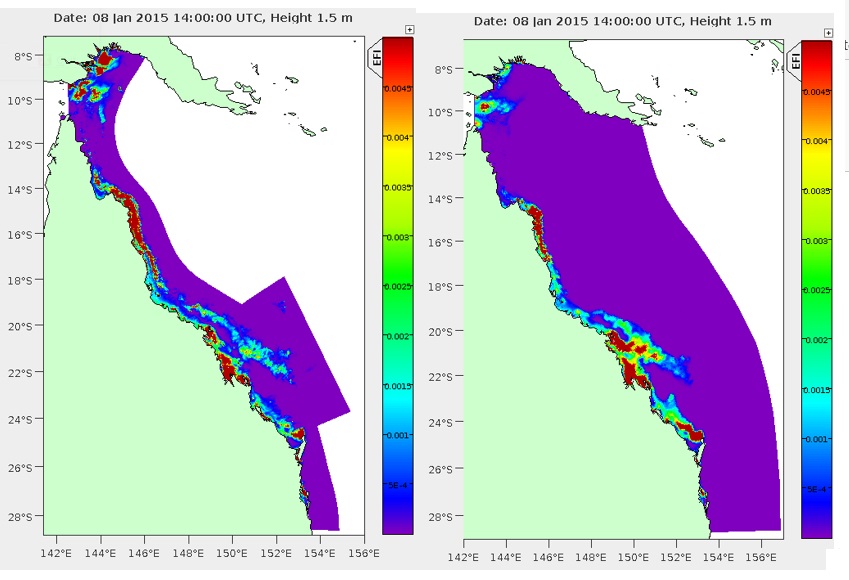
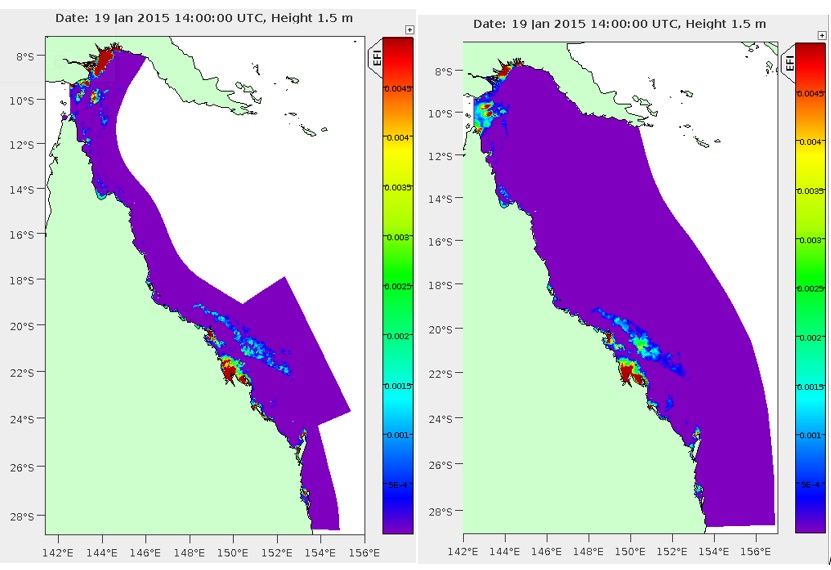
Figure 1. Snapshots of surface TSS kg m-3 produced by GBR sediment transport model during periods of high resuspension events (8th Jan. top plots) and moderate resuspension events (19th Jan bottom plots). GBR1: left plot and GBR4: right plot.
TSS time series comparisons between GBR1 and GBR4
Time series of TSS simulated with GBR sediment transport models – GBR1 (blue) and GBR4 (red). See site map for locations.
Site map: Coastal water quality monitoring sites. The colour map shows bathymetry truncated to 100 m depth.
High Island, Russell Island, Dunk Island, Fitzroy Reef
Snapper Island, Pelorus Island, Pandora Island, Daydream Island
Double Cone Island, Pine Island, Pelican Island, Barren Island