Biogeochemistry – GBR1
The GBR1 biogeochemical processes (e.g. the model equations) and parameters values are identical to the GBR4 configuration. The biogeochemical model tracers are initialized with the GBR4 model results on December 28th, 2014. This initialization does not use the higher resolution benthic layers that are available for some variables (seagrass and coral presence / absence). Dynamics that are known to exist at small scales are present in GBR1 but not represented in GBR4. This is due the inability of the coarse resolution to adequately resolve bathymetry and geography that are often the sources of turbulence, as well as the dynamics at small scales of the energy cascade. In this regard, GBR1 is a better model than GBR4, even though the formal quantitative skill assessment of GBR4 illustrates that’s its skill makes it suitable for a broad range of applications.
Chlorophyll
In the model, total chlorophyll a is the sum of chlorophyll a concentration of the four microalgae types (large and small phytoplankton, Trichodesmium and microphytobenthos). The below stills and animations show surface concentrations.
Large phytoplankton chl a, small phytoplankton chl a, Trichodesmium chl a, total chl a
Whole GBR1 grid – still / animation
Cape York – still / animation
Wet Tropics – still / animation
Burdekin Whitsundays – still / animation
Fitzroy and Burnett-Mary- still / animation
Particulates
Inorganic particulates includes fine inorganic sediment and organic particulates included biologically active deritus from phytoplankton and macrophytes.
Inorganic and Organic
Whole GBR1 grid – still / animation
Cape York – still / animation
Wet Tropics – still / animation
Burdekin Whitsundays – still / animation
Fitzroy and Burnett-Mary- still / animation
Inherent and apparent optical properties (IOPs and AOPs)
Inherent Optical Properties (IOPs) of the water column are calculated from the model biogeochemical state (phytoplankton biomass, particulate concentrations etc). These include the absorption and scattering properties of clear water, colour dissolved organic matter, suspended solids and each microalgal population.
IOPs: Vertical light attenuation (490 nm), total absorption (440 nm), total scattering (550 nm), vertical short wave attenuation
Whole GBR1 grid – still / animation
Cape York – still / animation
Wet Tropics – still / animation
Burdekin Whitsundays – still / animation
Fitzroy and Burnett-Mary – still / animation
From the calculation of the IOPs and the surface light field, apparent optical properties (AOPs), such as remote-sensing reflectance, can be determined, and compared to remotely-sensed products. The remote-sensing reflectance is a measure of the water-leaving radiance normalized by the at-surface downwelling solar irradiance and has units of sr-1. Thus both model outputs and observations can be quantified as a remote-sensing reflectance. To avoid confusion, we will use the term observed remote-sensing reflectance to refer to satellite-derived Rrs, and simulated remote-sensing reflectance to refer to Rrs calculated from the outputs of the biogeochemical model.
The calculation of simulated remote-sensing reflectance introduces a novel means of model assessment – simulated true colour. The simulated surface reflectance at the red, green and blue wavelengths are processed using the MODIS true colour protocols to produce simulated true colour images of the water surface, with features such as bottom reflectance, river plumes and microalgal blooms easily characterised by their colour.
AOPs: Remote-sensing reflectance at 470 nm, 555 nm and 645 nm, and simulated true colour
Whole GBR1 grid – still / animation
Cape York- still / animation
Wet Tropics – still / animation
Burdekin Whitsundays – still / animation
Fitzroy and Burnett-Mary- still / animation
The eReefs modelling team has published a paper on the use of the remote sensing reflectance and true colour produced by the eReefs biogeochemical model. BAIRD, M. E., CHERUKURU, N., JONES, E. M., MARGVELASHVILI, N., MONGIN, M., OUBELKHEIR, K., RALPH, P. J., RIZWI, F., ROBSON, B., SCHROEDER, T., SKERRATT, J., STEVEN, A. D. L. & WILD-ALLEN, K. A. 2016 Remote-sensing reflectance and true colour produced by a coupled hydrodynamic, optical, sediment, biogeochemical model of the Great Barrier Reef, Australia: comparison with remotely-sensed data Environmental Modelling and Software 78, 79-96.
The image below shows the true colour calculated at midday from the simulated remote-sensing reflectance of the eReefs 1 km model (Baird et al., 2016a) during the 2015 wet season. The animation moves northward from the southern end of the GBRMP. Black is land, yellow is river sediment, dark green is CDOM and green-blue is phytoplankton. Aside from revealing multiple phenomenon in one image, true colour images from the eReefs model can be used to understand biogeochemical responses on the GBRMP. For example, the eReef model true colour images allow visibility of the marine environment during high rainfall and the subsequent major river plumes whereas remote sensing colour images are highly limited due to the associated cloud cover. The influence of cyclone Marcia (category 4) and the start of cyclone Lam (monsoon trough when over Northern QLD) can be observed in mid February 2015.
Later in 2016, when the GBR1 simulation will have run for more than a year, and in situ observations for this period are available, a more thorough assessment of the performance of the GBR1 will be possible. The comparison undertaken here will focus on the Fitzroy and Burdekin River regions.
And here is GBR1 with hourly output of simulated true colour, and a moon in the top left – look for the greater impact of new and full moons on tides and therefore resuspension.
Cape York chlorophyll concentration
To assess the model prediction of chlorophyll in the Cape York region we have plotted surface chlorophyll from 1 km eReefs model (left most), OC3M calculated from simulated remote-sensing reflectance (left centre), OC3M from MODIS-observed remote-sensing reflectance (right centre) and the chlorophyll calculated using an inverse optical model produced by the CSIRO remote-sensing team. Below is an animation from 3 Dec 2015 – 29 Mar 2016, and a still from 29 Mar 2016.
Interestingly, the in situ model looks more like the inverse optical model, demonstrating through different means an ability to quantify chlorophyll in complex, coastal waters. Further, the model simulated OC3M chlorophyll looks like the observed OC3M, demonstrating that the model is producing realistic results.
Burdekin region
As expected the model bathymetry in the Burdekin region is similar in the GBR4 and GBR1 configurations, as both configurations are based on the same 100 m resolution data set. Along the coast, shallower regions that are resolved as water in GBR1 appear as land in GBR4. Significant differences exist on the outer reef, where water column depth varies between GBR1 and GBR4 by more than 10 m at some locations.
Below are links to comparisons of GBR4 and GBR1 for the Burdekin Region
Bathmetry
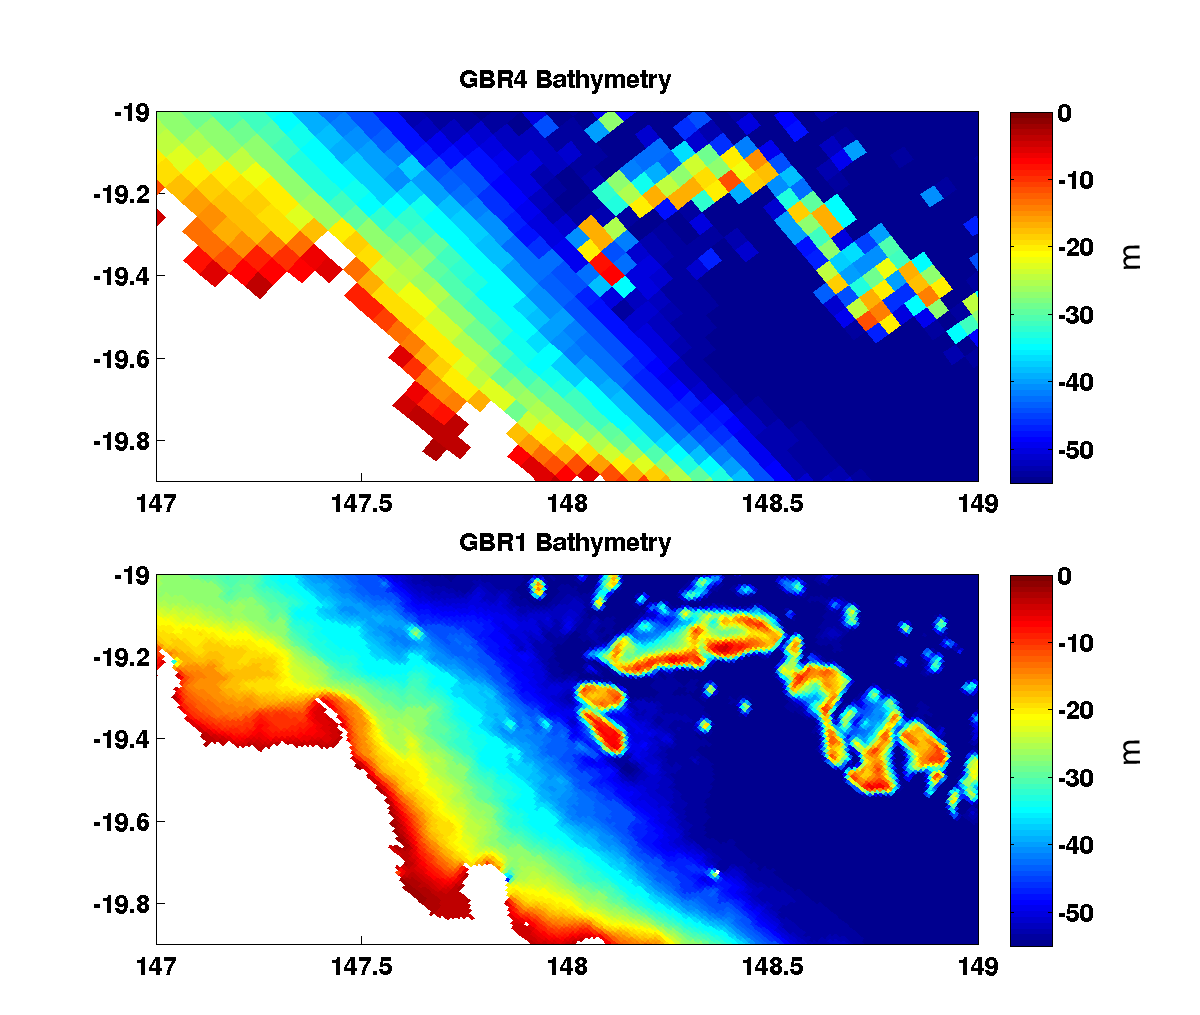
Figure 1 GBR4 (top) and GBR1 (bottom) bathymetry in the Burdekin River region. Note the entrance to the Burdekin River (19.65 S, 147.6 E) is resolved as a 2 x 2 grid cell entrance in GBR1, but is a straight coastline in GBR4.
Chlorophyll
Figure 2 GBR4 (top) and GBR1 (bottom) simulated surface chlorophyll a (sum of 4 phytoplankton types) on January 10th in the Burdekin river region. Simulated chlorophyll a in GBR1 shows structures in the GBR lagoon, and narrow plumes along the shoreline, that are absent in GBR4. Simulated chlorophyll a in GBR1 also has more fine-scale circulation-generated structures over the reef than in GBR4.
Nitrate
Figure 3 GBR4 (top) and GBR1 (bottom) simulated surface nitrate on January 10th, around the Burdekin River region. The Burdekin River coastal nutrient plume is a more coherent feature in GBR1
Sediment
Figure 4 GBR4 (top) and GBR1 (bottom) simulated surface suspended sediment Jan 10th 2015, in the Burdekin River region. The differences between the two configurations are larger for suspended sediment than nitrate or chlorophyll. Large sediment plumes are present in GBR1, as well as large re-suspension patches on the reef, both absent in GBR4.
Simulated light above seagrass
Fig. 5. Simulated running monthly mean bottom light (above the seagrass canopy) on the 4 Jan 2015 from GBR4 (top) and GBR1 (bottom). Grey areas have a daily dose of photons < 2 mol photon m-2, and will have a negative net seagrass growth. Dark blue areas have sufficient light for Halophila, but not Zostera. Above a daily dose of 4 mol photon m-2 (sky blue to red) both seagrass types are viable. Significant areas that are viable for seagrass in GBR1 are land in GBR4, illustrating the improvement in GBR1 for modelling seagrass due to the better resolved coastline. The most significant change in bottom light is in the inshore strip that is represented as land in GBR4, but is wet in GBR1. As a result, it is expected that over time GBR1 will develop a larger area of seagrass, especially Zostera, than captured in GBR4 model.
Simulated true colour
Fig 6. Simulated true colour on the 4 Jan 2015 from GBR4 (top) and GBR1 (bottom). The location of the Burdekin River entrance is shown. GBR1 has 5 grid cells that are wet in the mouth of the Burdekin that appear as land in the GBR1. True colour is rendered from a scaled Red/Green/Blue colour map using the remote-sensing reflectance at 645, 555 and 470 nm, following the MODIS protocols (Baird et al., 2016).
Fitzroy region
The Fitzroy region is another area of interest, containing the Fitzroy River, the isolated Capricorn Bunker reefs, and with continental shelf only 80 km wide. Similar to the Burdekin region, the two configurations show significant bathymetric, nutrient and suspended sediment differences over the reef matrix (Fig. 7a ). The coastline, with small bays and coastal channels, the continental slope and deep channels is better resolved in GBR1, leading to different pathways and structures in water circulation.
a)
 b)
b)
c)
 d)
d)
Figure 7 Fitroy region Comparison of GBR1 and GBR4 a) Bathymetry b) Simulated surface total chlorophyll a (10/1/2015) c) Simulated surface nitrate (10/1/2015) d) Simulated surface Inorganic Fine Sediment