Reef Restoration and Adaptation Program (RRAP) – cooling load metrics
Sample outputs from reef cooling analysis:
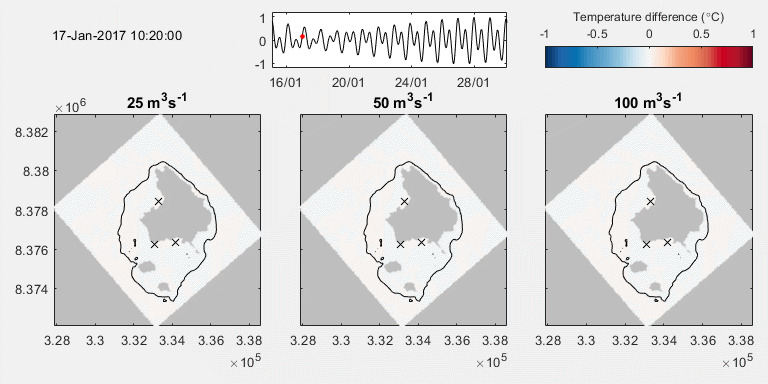
Figure caption. Cooling load metric. A. Reef name, bathymetry (10 and 20 m isobaths), reef area and the SST and phase of the moon of the time of the snapshot, given in local time in the panel title. B. Temperature anomaly, ΔT = T – T15 Jan – 1°C. C. Site cooling load. D. Reef age, a spatially-resolved measure of the time water has been above the reef. E. Reef cooling load, with the colour bar scaled to 1353 J m-2 s-1, the solar constant giving the mean solar forcing at a zenith of 0°, and at the top of the atmosphere (TOA). F. A time-series of the spatially-integrated reef cooling load (blue) and site cooling load (green).
![]()
![]()