|
Workspace 7.1.0
|
|
Workspace 7.1.0
|
Prerequisites for following this tutorial:
A Workspace plugin developer will at some point need to debug a section of code. Currently, there are two main ways to debug a failing Workspace operation:
This tutorial will focus on using a debugger, specifically Visual Studio, to help debug your code.
By the end of the tutorial we will:
Qt Visual Studio tools provide several features among which we are chiefly interested in the debugging extensions for Qt data types. This allows us to inspect types like QString using the debugger.
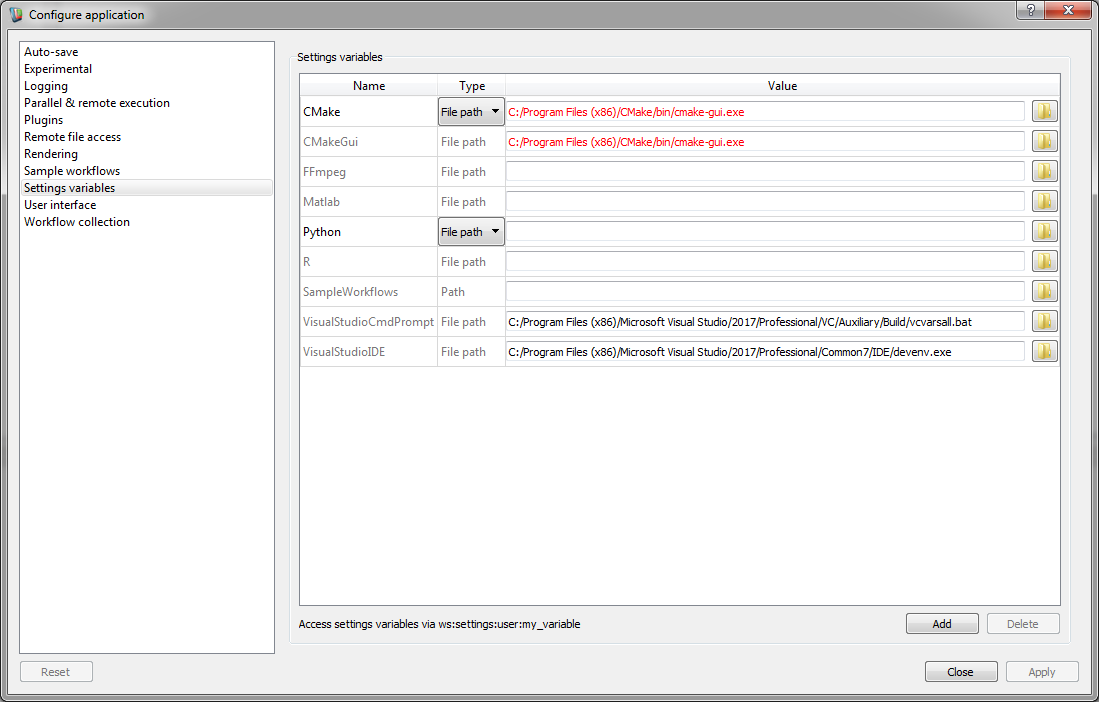
The tutorial Writing a Simple Workspace Plugin explains how to manually specify the path to the cmake-gui executable in Workspace settings. Note that the Visual tudio command prompt and IDE launchers will automatically find the path to the relevant executables and store it in the Workspace settings if Visual Studio has been installed in the default location. We can also use Workspace settings to manually specify the path for launching Visual Studio command prompt and IDE.
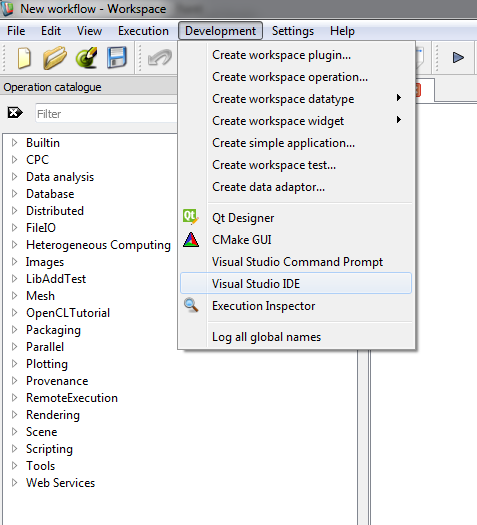
Once the correct path is specifed, we have two ways of debugging in Visual studio. One is to launch Visual Studio from the Workspace Editor, another one is to launch Workspace Editor from Visual Studio.
Create or open the workflow that needs debugging
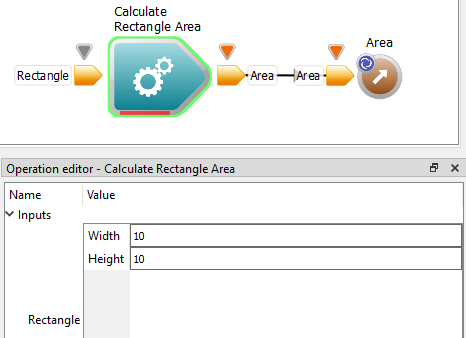
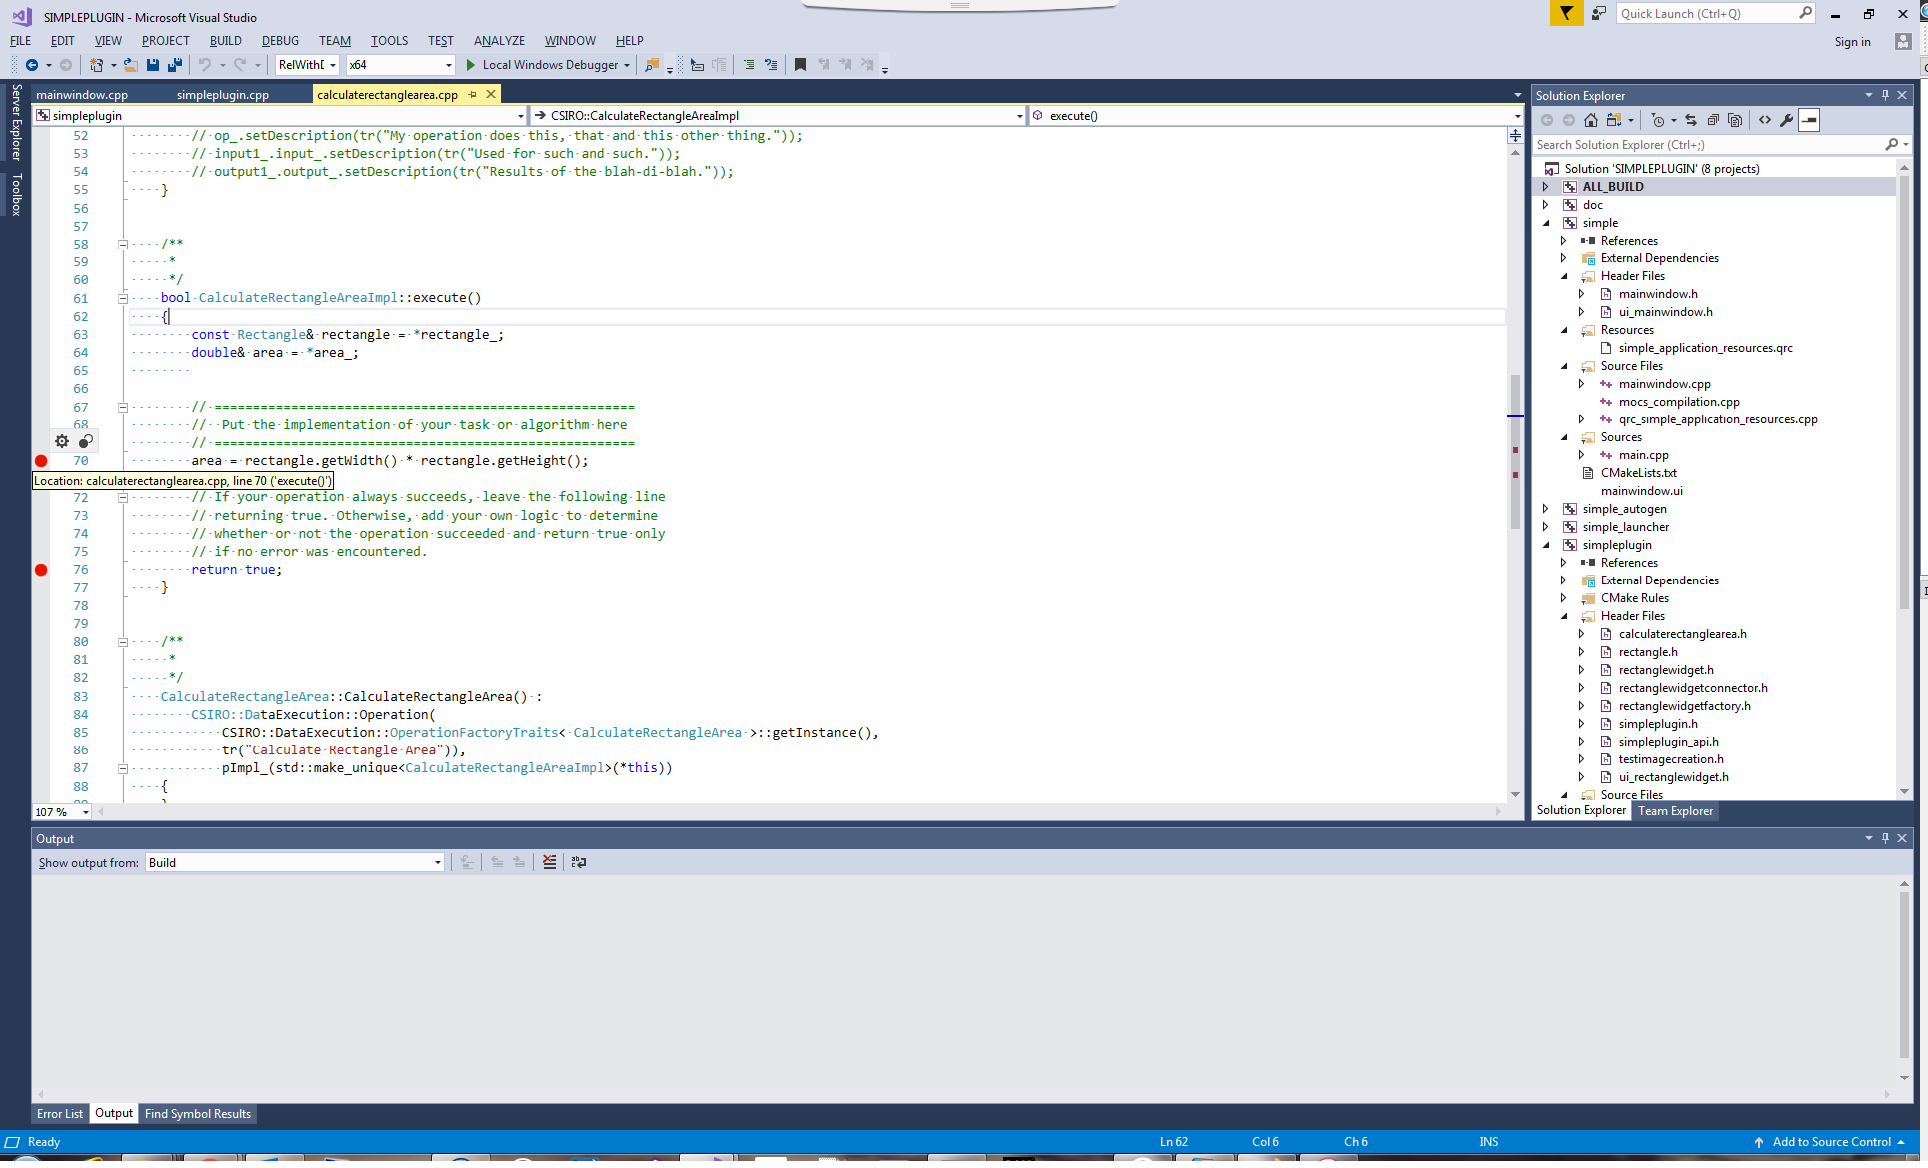
If you have an idea of where in the code things may be going wrong, place breakpoints in and around that piece of code.
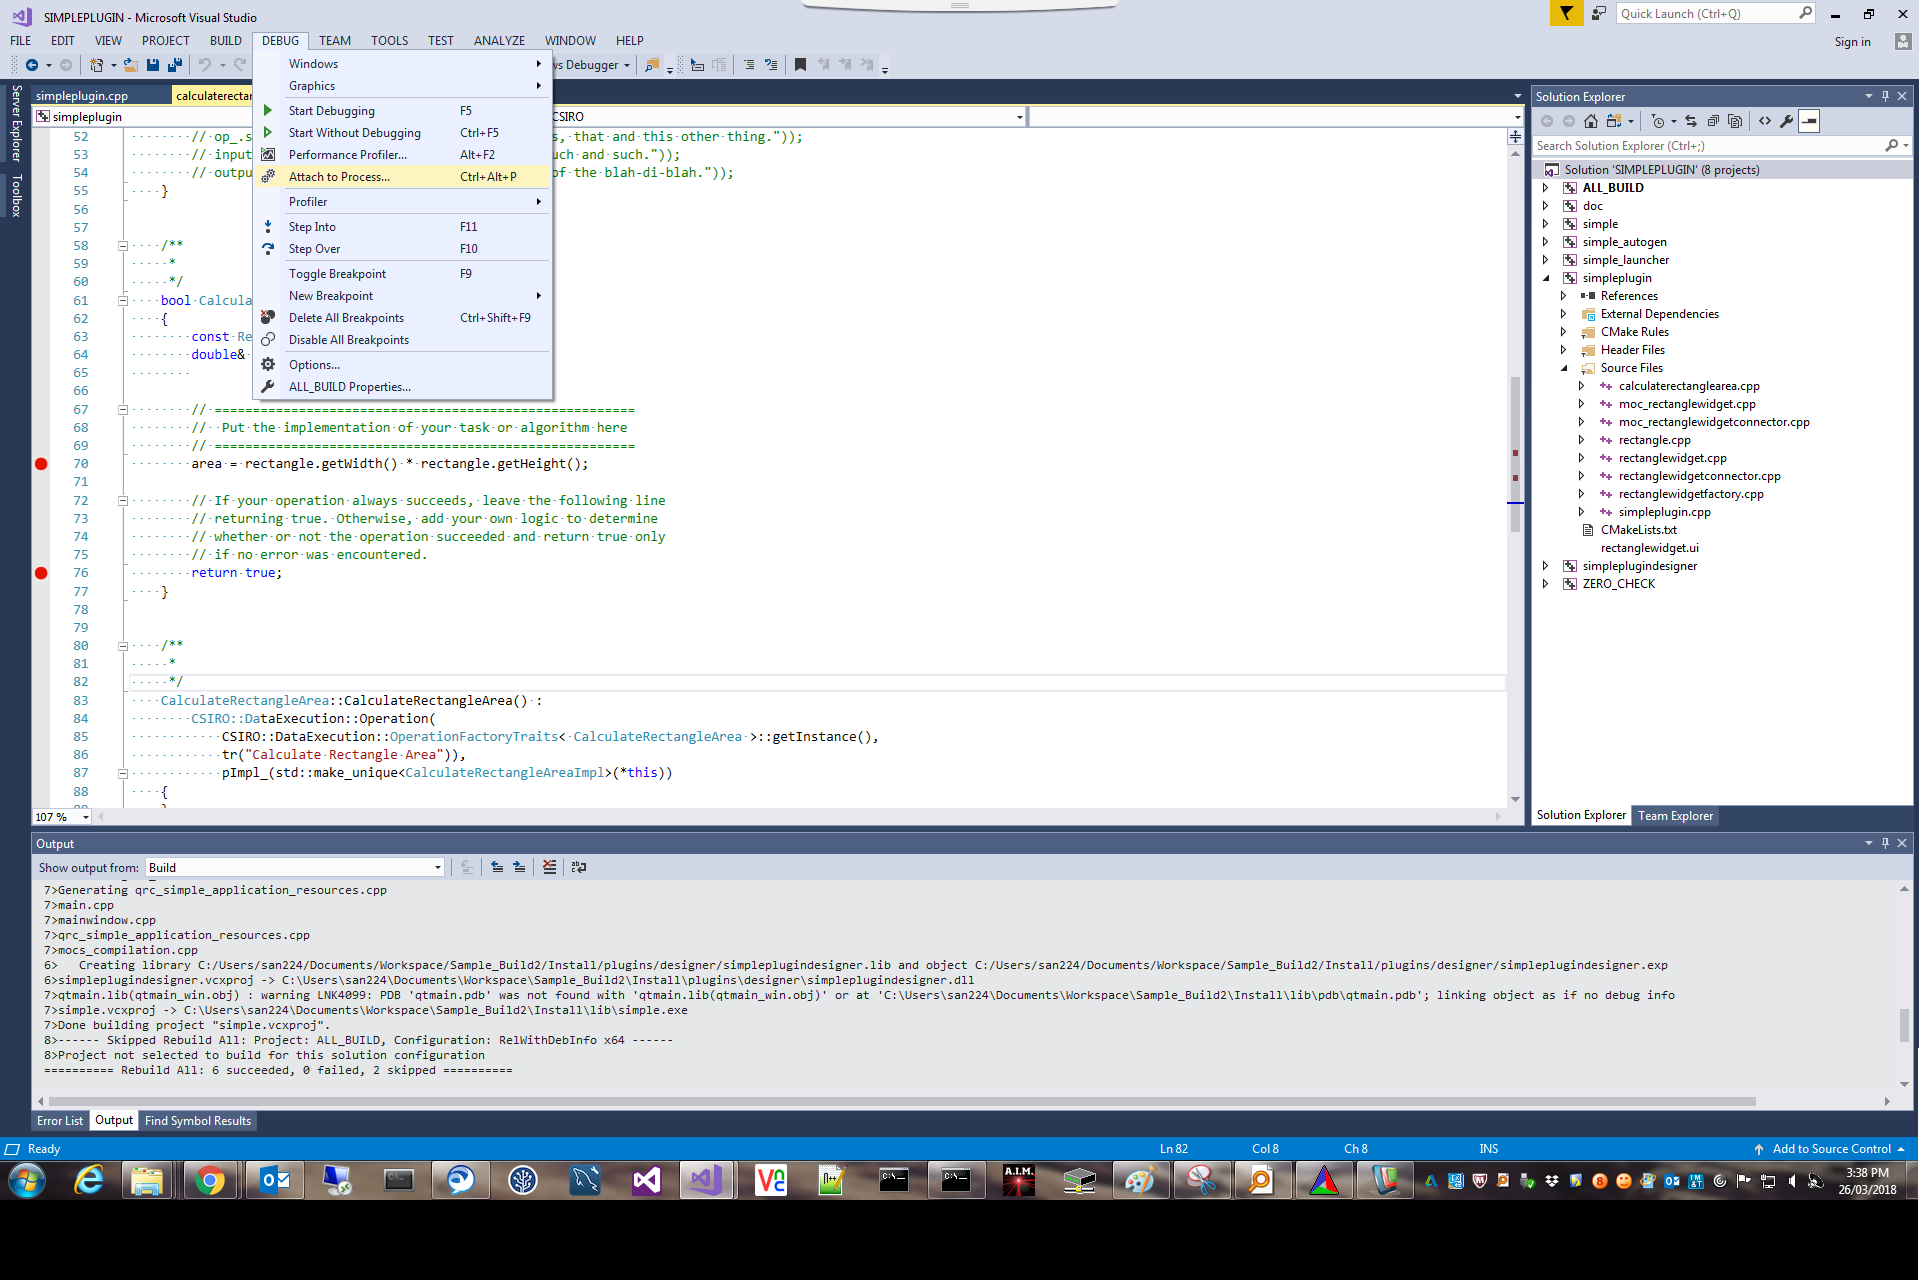
Attach the debugger to a running process by navigating to Debug -> Attach to Process...
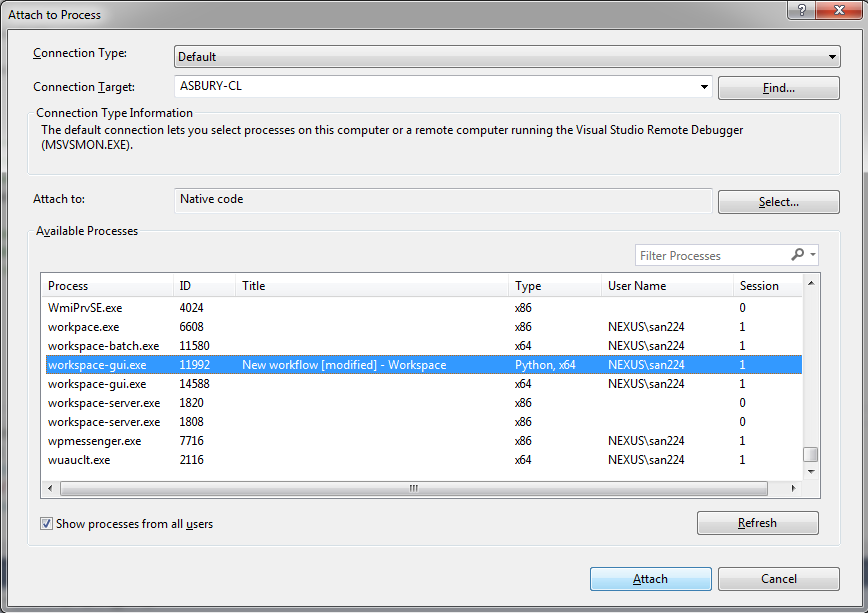
Choose workspace-gui.exe as the process, also select "Native code" manually for the "Attach to" option, then we will debug
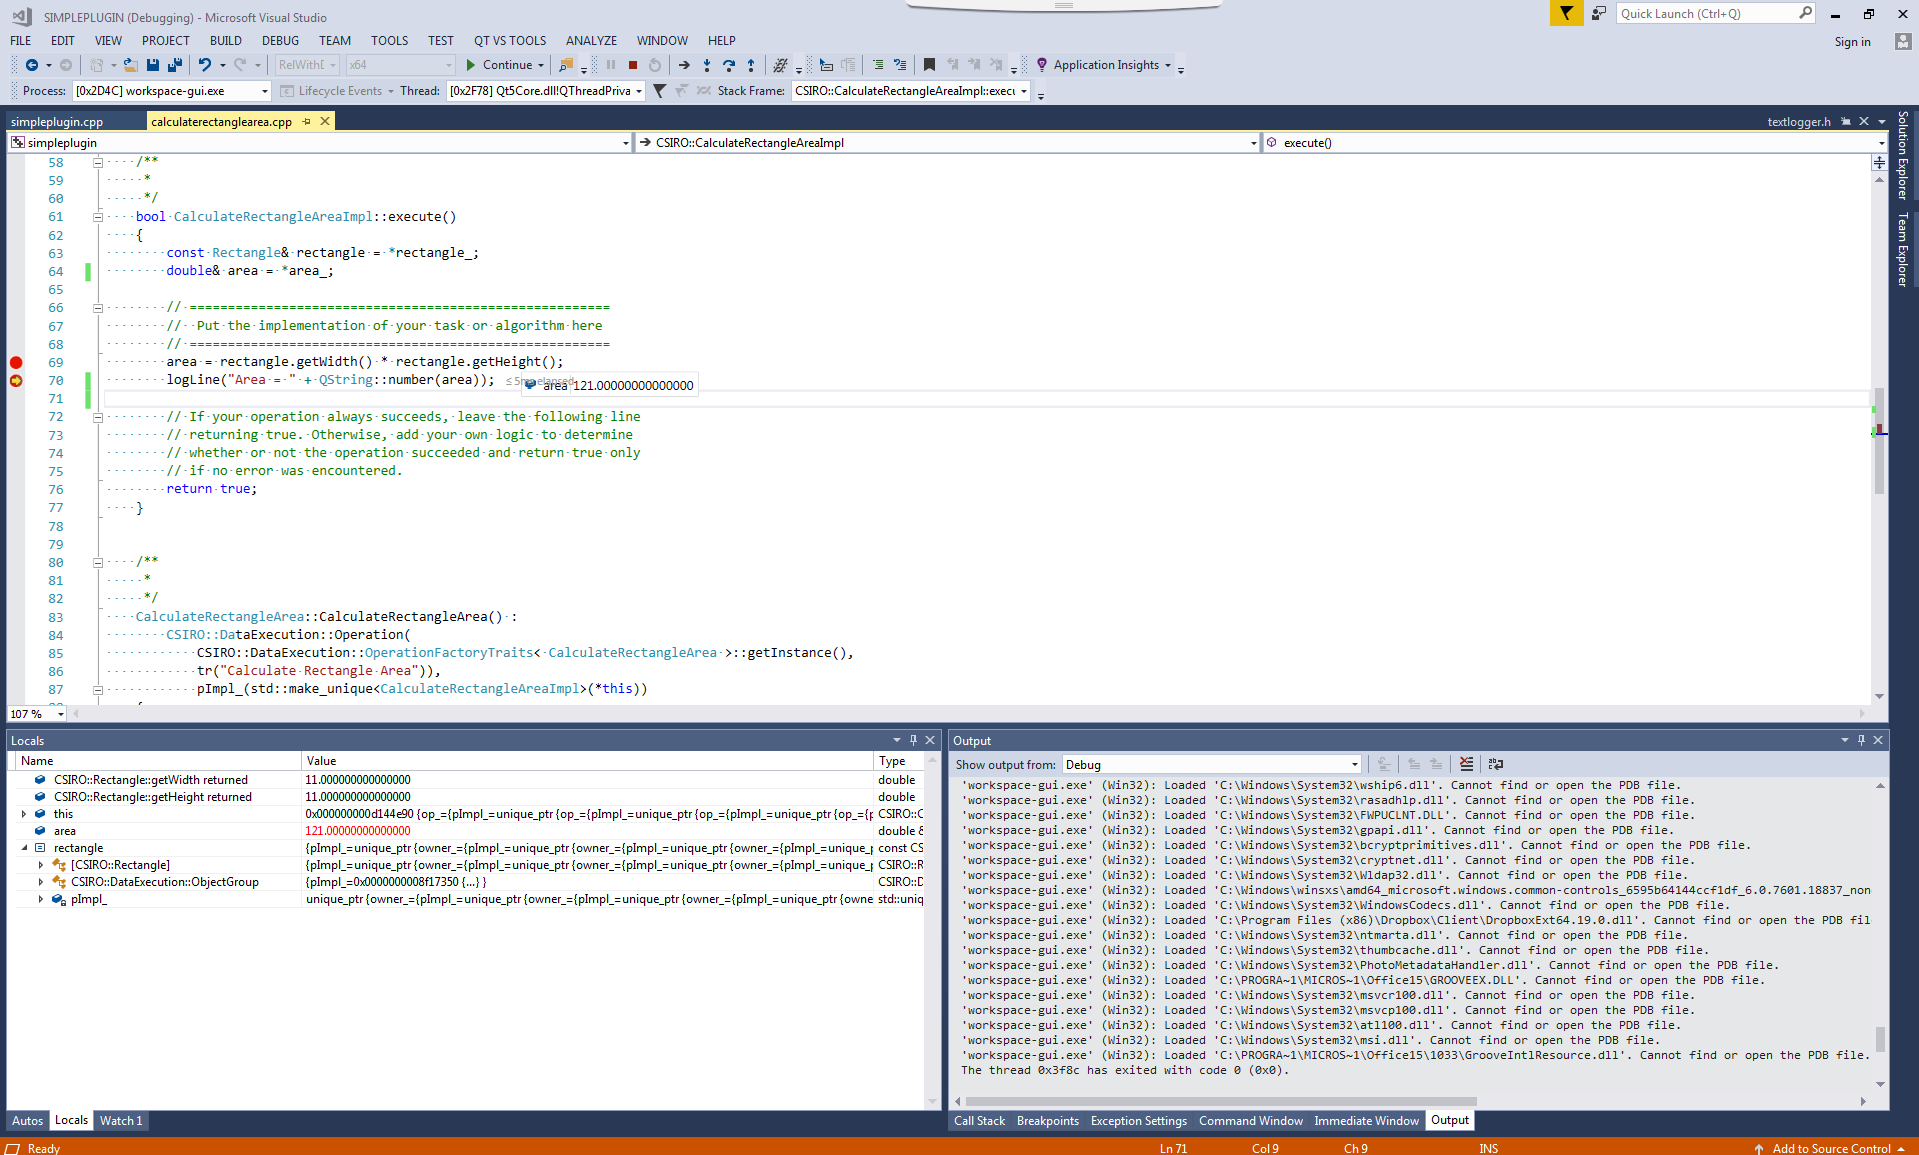
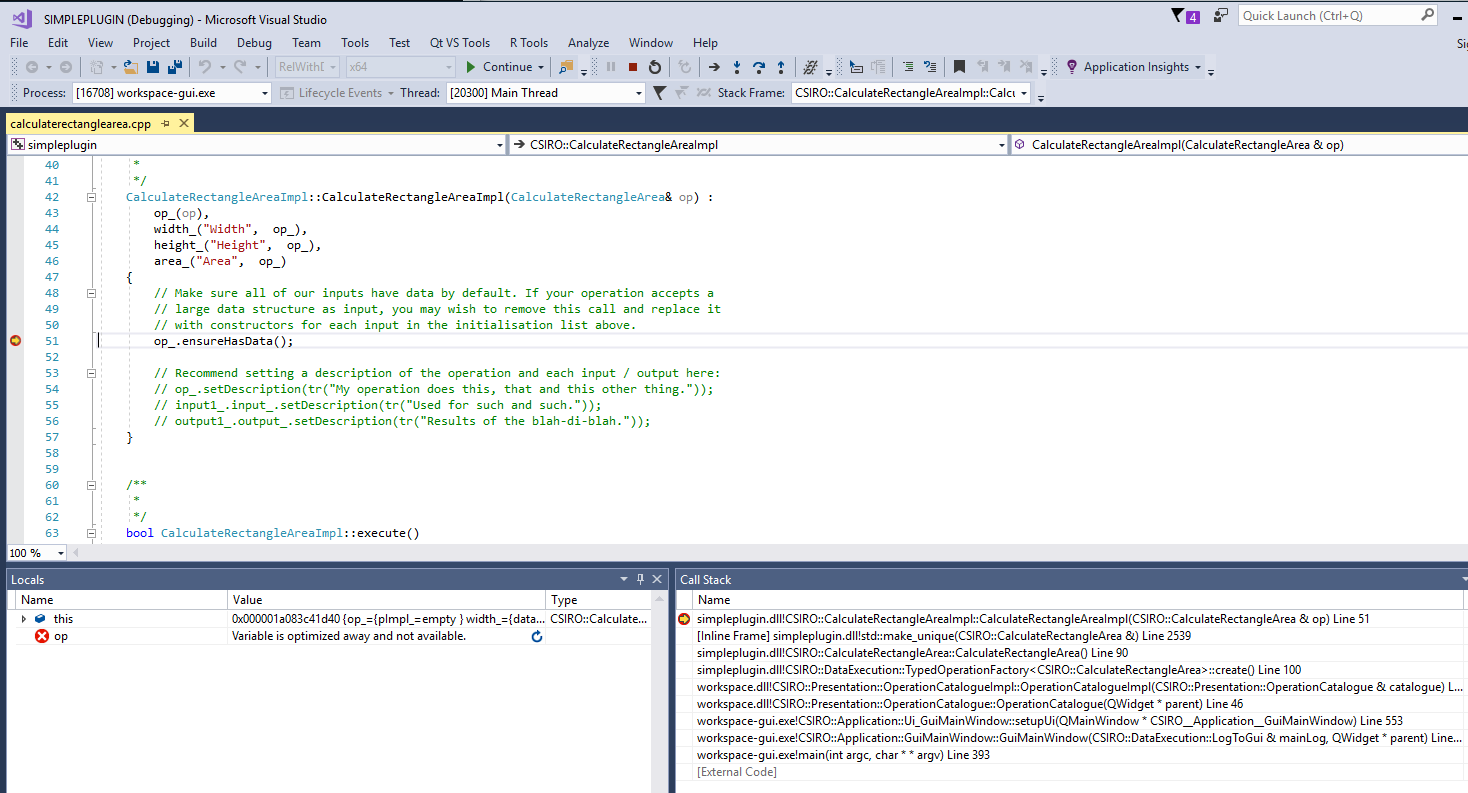
When the execution reaches one of the breakpoints you can step through the code, examine variables, call stack, memory, threads, etc.
Launch Visual Studio by typing in the command line "workspace-batch.exe --launch devenv". Open your plugin solution, and set it to startup project.
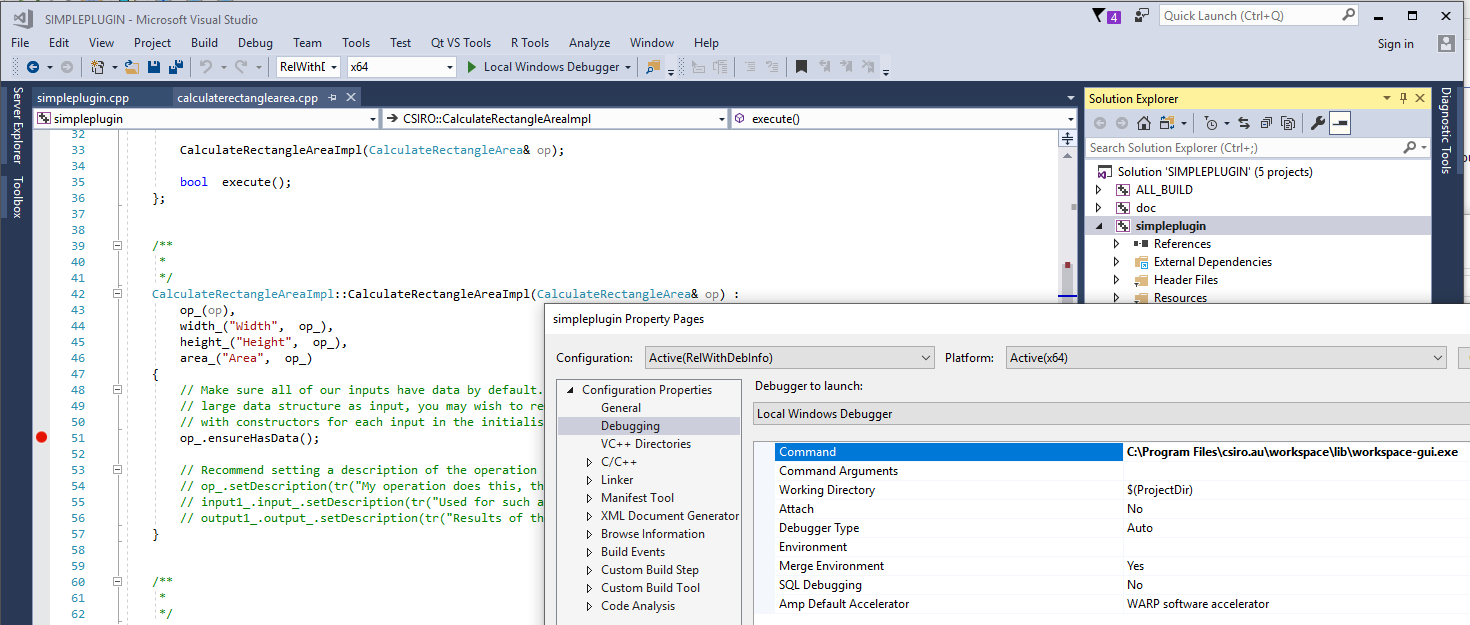
Right click on the "Property" of your project and select "Debugging", then in the "Command" option, navigate to "workspace-gui.exe" under the lib directory. Please note that the "workspace-gui.exe" is not the one under the bin directory since that one is actually a launcher which will call the one under lib directory. If you have installed MicroSoft Child Process Debugging Power Tool, you can also debug with the "bin\workspace-gui.exe".
Now you can place breakpoints and start debugging, then the Workspace Editor will be launched and you can debug as ususal. In this way, you don't need the "Attach to Process" step.
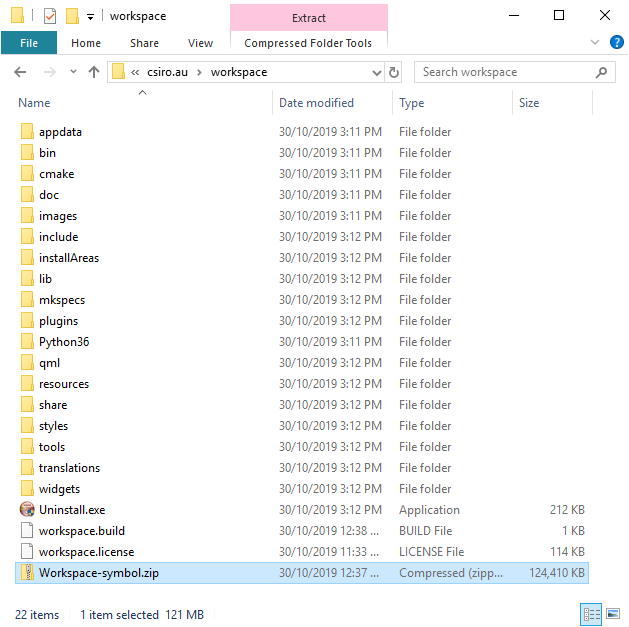
If the Workspace you installed is with symbols(usually there will be a postfix of "with-symbols" in the install package's name), you can find a file "Workspace-symbol.zip" in your installed workspace path.
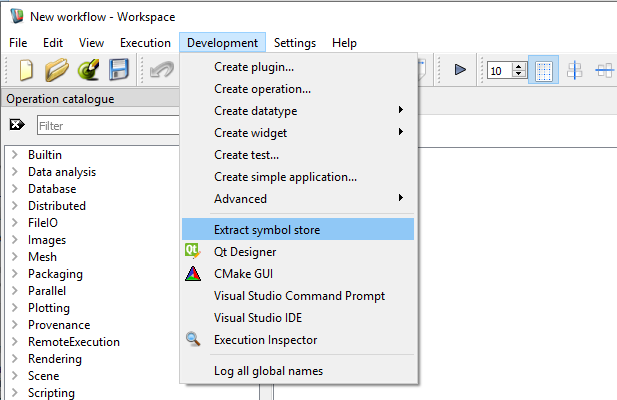
In that case, you can also find in the Workspace menu an option "Development->Extract symbol store" (this menu option won't show in Workspace without symbols).
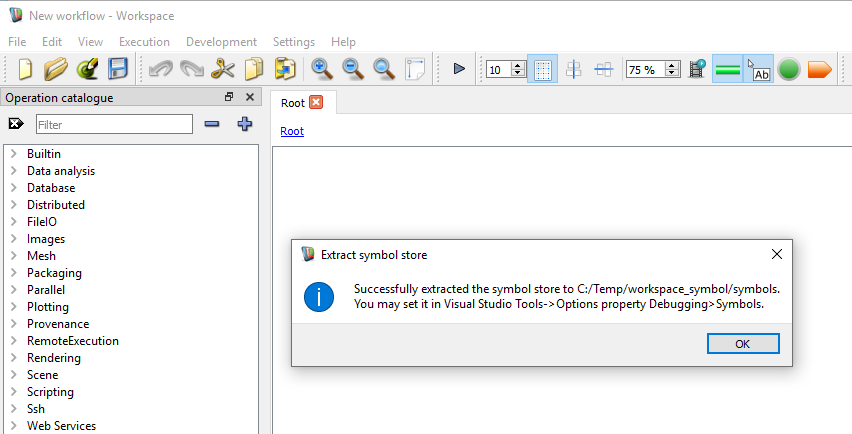
By clicking on "Extract symbol store", you can select a directory to extract the symbols. If the symbol store is successfuly extracted, a dialog will pop up.
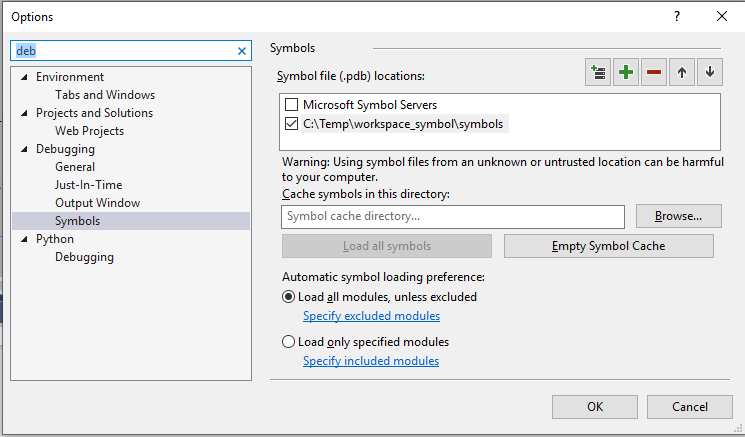
Now you can set up the symbols path in Visual Studio. Click "Tools -> options", select "Debugging -> Symbols", and add a path to the directory where you extracted the Workspace symbols.
Once the symbols path is successfuly set up, you can debug with the Workspace symbols.
This tutorial introduced you to the essential elements of debugging a section of code. You should now have an understanding of:
For further information, see Feature Tour of the Visual Studio Debugger