|
Workspace 7.1.0
|
|
Workspace 7.1.0
|
Prerequisites for following this tutorial:
There are currently 2 debugging tools available for your plugin and Workspace based application. One is to query the call stack of the current thread. the other one is capturing unhandled exception and write to a mini-dump file on Windows.
The call stack query functionality can be accessed by calling CSIRO::System::Utilities::getCurrentStack(). A QStringList is returned with callstack layers from top to bottom. The function is declared in this header file:
#include "Workspace/Application/System/systemutilities.h"
When symbols are available, modules, functions' name and source code path with line numbers can be resolved, otherwise only module name and functions' address appear in the result. Symbols are located in all install areas under the following sub-directories:
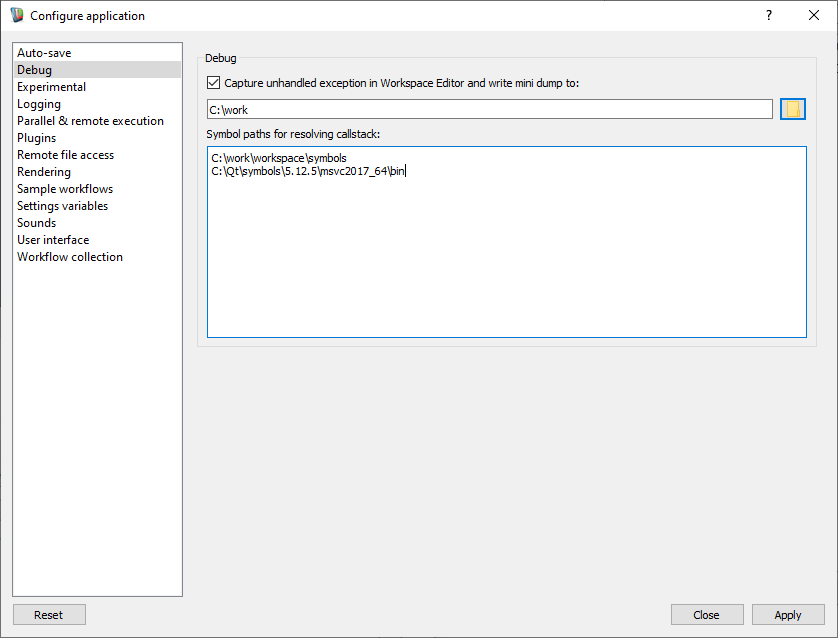
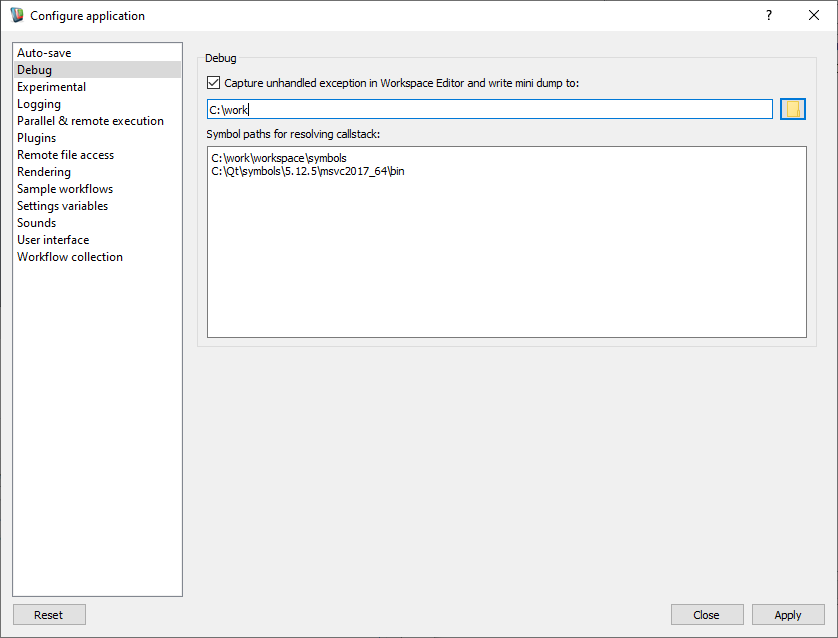
In addition to that, you may specify symbol paths in Workspace Editor's menu: Settings -> Configure application -> Debug, one path per line. The symbol paths accept folders having .PDB files or a Windows Symbol Store.
The most obvious usage of getting the callstack is to support debugging via log. This can be done in any part of the plugin and Workspace based application code. Just connect the QStringList elements into a single QString and pass it to CSIRO::Application::LogManager::logLine(). Another situation is to help locate and pair up the allocation and release call stack to track resource leaks. For example, you may store the callstack at the allocation of a resource along with the resource. When you realised one resource was leaked, you may inspect the callstack on the resource to find out how it was allocated.
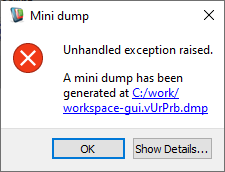
By default, Workspace Editor will capture an unhandled exception and write a mini-dump file. A mini-dump file is a small snapshot at the point when the unhandled exception occurs. It may be opened in Visual Studio to check the callstack. Note, it's not a full dump, so no heap information stored.
You may specify where to store the mini-dump file in Workspace Editor's menu: Settings -> Configure application -> Debug
A mini-dump file is useful for developers to investigate what happened in the user's environment. A plugin or Workspace based application developer may ask their users to send the mini-dump. As long as the developer still has the symbol files of the plugin or application, the callstack will be resolved in Visual Studio. Note, as Workspace ships with symbols in Windows builds, you may specify symbol path in Visual Studio to resolve callstack of Workspace. See how to extract the symbol store to a folder in Extract symbol store .
Workspace based applications can set up the mini-dump capture by calling
CSIRO::System::Utilities::setupMiniDumpCapture(appName);
where appName could be the same as the executable's base name. Optionally if the appName is provided with an absolute path, the mini-dump file will be generated in the specified folder. The function is also declared in this header file:
#include "Workspace/Application/System/systemutilities.h"
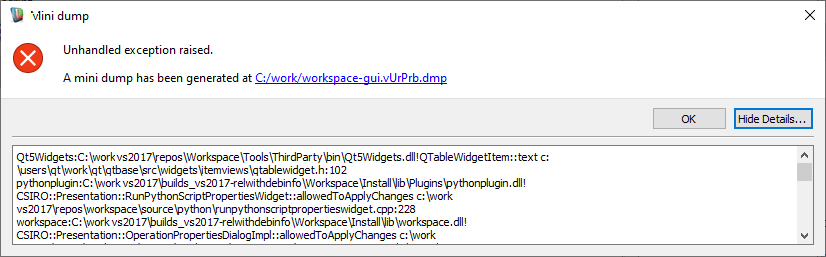
Once an application has enabled the mini-dump capturing, any unhandled exception will be captured and Workspace will handle that and pops up a dialog to indicate where the mini-dump goes. A callstack is also generated in the details of the dialog. The application may call setupMiniDumpCapture() more than one time to change the appName and location of where to put the mini-dump file.
The Application Wizard Using the "Create simple application" code wizard may generate this call for you. If not needed, please comment out. If a file 'disable.minidump' exists next to the executable, e.g. lib/disable.minidump next to lib/workspace-gui.exe, setupMiniDumpCapture() will not set up mini-dump capture. Workspace editor also has settings in the debug panel to disable minidump.
For further information, see Symbol Server and Symbol Stores and Minidump Files