Model Components
At the core of Atlantis is a deterministic biophysical sub-model, coarsely spatially-resolved in three dimensions, which tracks nutrient (usually N and S) flows through the main biological groups in the system. The primary ecological processes modelled are consumption, production, waste production, migration, predation, recruitment, habitat dependency, and mortality. The trophic resolution is typically at the functional group level. Invertebrates are typically represented as biomass pools, while vertebrates are represented using an explicit age-structured formulation. The physical environment is also represented explicitly, via a set of polygons matched to the major geographical and bioregional features of the simulated marine system (e.g. Figure 1). Biological model components are replicated in each depth layer of each of these polygons. Movement between the polygons is by advective transfer or by directed movements depending on the variable in question.
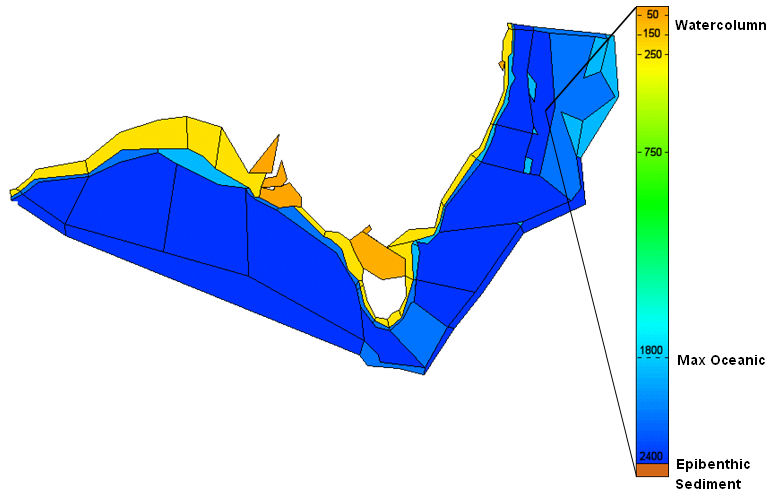
Figure 1: Example Atlantis model geometry
Atlantis also includes a detailed industry (or exploitation) sub-model. This model deals not only with the impact of pollution, coastal development and broad-scale environmental (e.g. climate) change, but is focused on the dynamics of fishing fleets. It allows for multiple fleets, each with its own characteristics of gear selectivity, habitat association, targeting, effort allocation and management structures. At its most complex, it includes explicit handling of economics, compliance decisions, exploratory fishing and other complicated real world concerns such as quota trading. All forms of fishing maybe represented, including recreational fishing (which is based on the dynamically changing human population in the area).
The exploitation model interacts with the biotic part of the ecosystem, but also supplies ‘simulated data’ to the sampling and assessment sub-model. The sampling and assessment sub-model in Atlantis is designed to generate sector dependent and independent data with realistic levels of measurement uncertainty evaluated as bias and variance. These simulated data are based on the outputs from the biophysical and exploitation sub-models, using with a user-specified monitoring scheme. The data are then fed into the same assessment models used in the real world, and the output of these is input to a management sub-model. This last sub-model is typically a set of decision rules and management actions (currently only detailed for the fisheries sector), which can be drawn from an extensive list of fishery management instruments, including: gear restrictions, days at sea, quotas, spatial and temporal zoning, discarding restrictions, size limits, bycatch mitigation, and biomass reference points.