Mapping flood events across Australia using NovaSAR-1 and Sentinel-1
Australia is prone to frequent and severe flooding events that cause significant damage to infrastructure, agriculture, and ecosystems.
The challenge
Traditional optical sensors have limitations in detecting and monitoring flood extent and dynamics, especially in cloudy and vegetated areas.
Opportunities
Showcasing the capabilities of NovaSAR-1 and Sentinel-1 in flood mapping and monitoring within Australia whilst developing a reliable flood detection algorithm that can adapt to diverse landscapes and land cover types.
Ensuring the precision and dependability of produced flood maps through validation with other sources of data. Providing flood maps to relevant parties and end-users for informed decision-making and effective disaster management.
The project
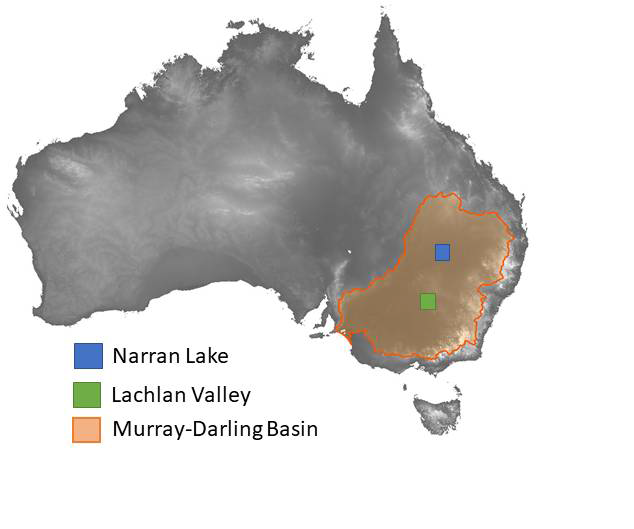
Map showing the location of the Narran Lake and Lachlan Valley study sites inthe Murray–Darling Basin in southeast Australia.
NovaSAR-1 and Sentinel-1 are two complementary synthetic aperture radar (SAR) satellites that can provide high-resolution and all-weather imagery of the Earth’s surface. This study compares flood extent as derived from C-band Sentinel-1 and S-band NovaSAR-1 for both co-polarised and cross-polarised bands.
Two study sites were used, both of which are located in the Murray–Darling Basin in southeast Australia and were affected by floods in late 2022, Narran Lake and Lachlan Valley.
What we did
A series of pre-processing steps were applied, including radiometric calibration, speckle filtering, geometric correction, and co-registration, to ensure the consistency and quality of the SAR data.
An algorithm based on statistics was used to determine if a pixel was wet or dry. Pixels with a low radar backscatter value, as determined by the algorithm, were used to produce binary flood maps that indicate the presence or absence of water on the ground. Elevation information was also used to constrain those pixels identified as inundated, to valleys and floodplains. Optical imagery from other satellites, acquired at a similar time to the SAR data, were used to validate the flood maps.
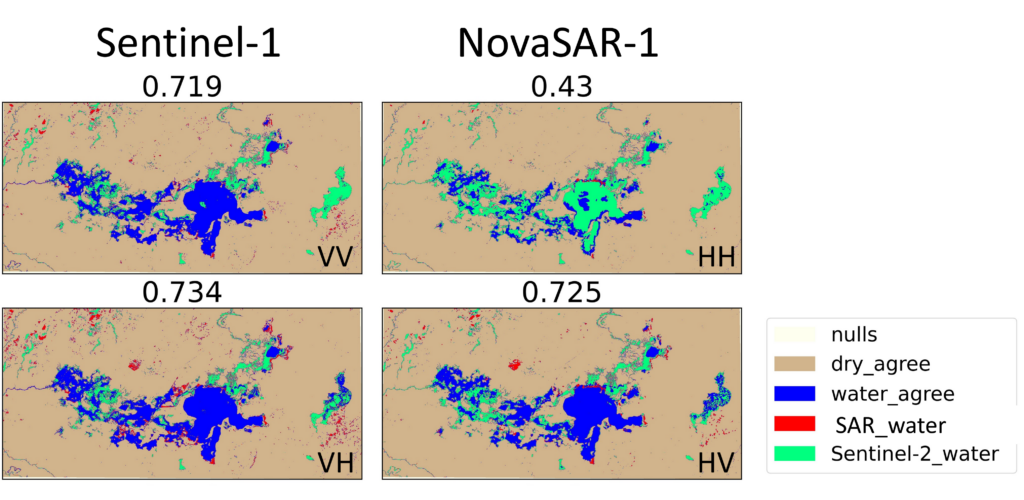
Comparison of Sentinel-1 and NovaSAR-1 flood maps to Sentinel-2 flood maps. F1-scores are shown above each comparison
Outcomes
Demonstrated the feasibility and value of using NovaSAR-1 and Sentinel-1 for flood mapping and monitoring in Australia.
The flood detection algorithm was proven to be robust and semi-automated, with the ability to handle complex and diverse landscapes and land cover types.
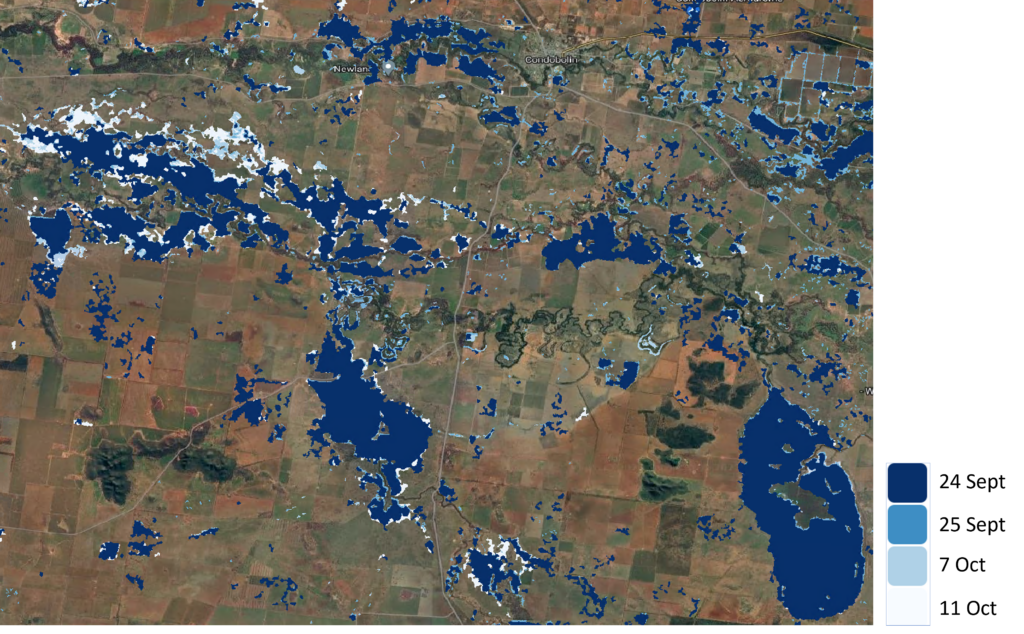
Sentinel-1 and NovaSAR-1 flood maps for the Lachlan Valley study site. Different colours represent different dates. The flood maps are overlaid on a Google Maps background.
The case study also emphasized the potential of combining NovaSAR-1 and Sentinel-1 with other data sources, such as optical imagery and elevation models, to enhance flood mapping and monitoring capabilities. Future work will focus on the refinement and automation of the method.
To read a more in-depth version of this case study see: 2023 IEEE International Radar Conference (RADAR) | 978-1-6654-8278-3/23/$31.00 ©2023 IEEE | DOI: 10.1109/RADAR54928.2023.1037114