Rondo – Interactive Visual Exploration of Chromosome 3D Connectivity Maps
The Challenge
Eukaryotic chromosomes possess an intricate 3D structure that helps control gene expressions by bringing in close spatial proximity genes with regulatory elements and by organizing chromosomes into compartments and domains.
In recent years, we saw the advancement of a new set of techniques to capture the spatial arrangement of chromosomes including Hi-C, ChIA-PET and 5C.
The volume and complexity of these data make them difficult to analyse and explore, especially for researcher outside of this field.
Our Response
In collaboration with Chromosome Conformation Capture experts at the Garvan Institute of Medical Research, we set about creating a clearer and simpler visualization of 3D chromosome data compared to existing tools. We did this by integrating data pre-processing with visual analytics.
The Results
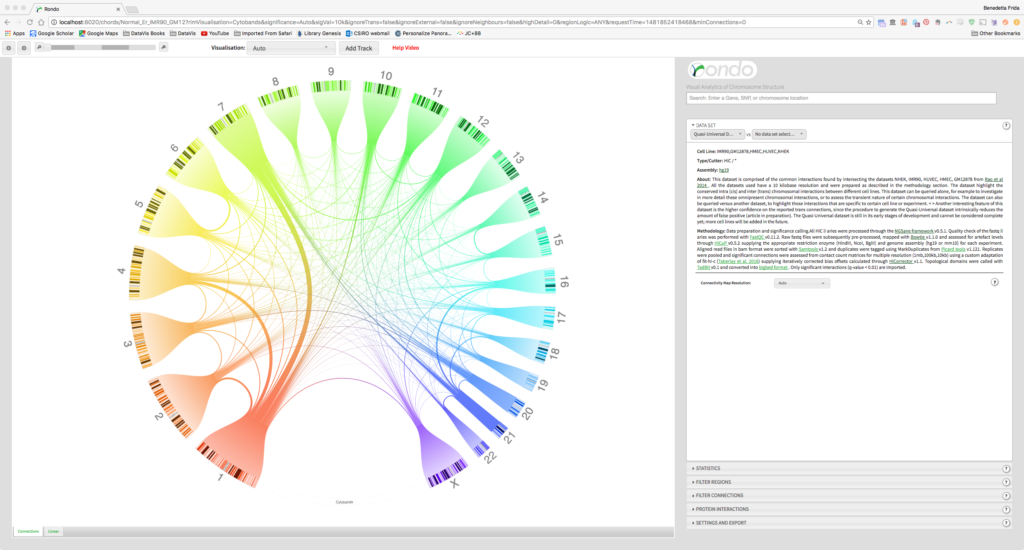
We developed Rondo, a web-based tool that enables any molecular biologist to interactively explore chromosome conformation data sets from a wide range of technologies, across numerous human and mouse cell lines. Rondo’s circular layout was inspired by Circos, but unlike it, Rondo pre-clusters and indexes the data at varying scales allowing the user to switch between connectivity maps at different resolutions.
A user is therefore presented to an always uncluttered, clear view of chromosome contacts with the possibility to zoom into an area of interest, as Rondo seamlessly transitions between connectivity maps.
The default dataset displayed in Rondo is a novel dataset called Quasi-Universal, created as the intersection between the higher resolution datasets from all currently available normal human cells. The Quasi-Universal dataset, which currently is comprised of 38,482 conserved chromosomal interactions across five cell types, will help to unveil important epigenetic trait and mechanisms, much like the concept of housekeeping did in molecular biology and gene expression.