Quantifying a baseline
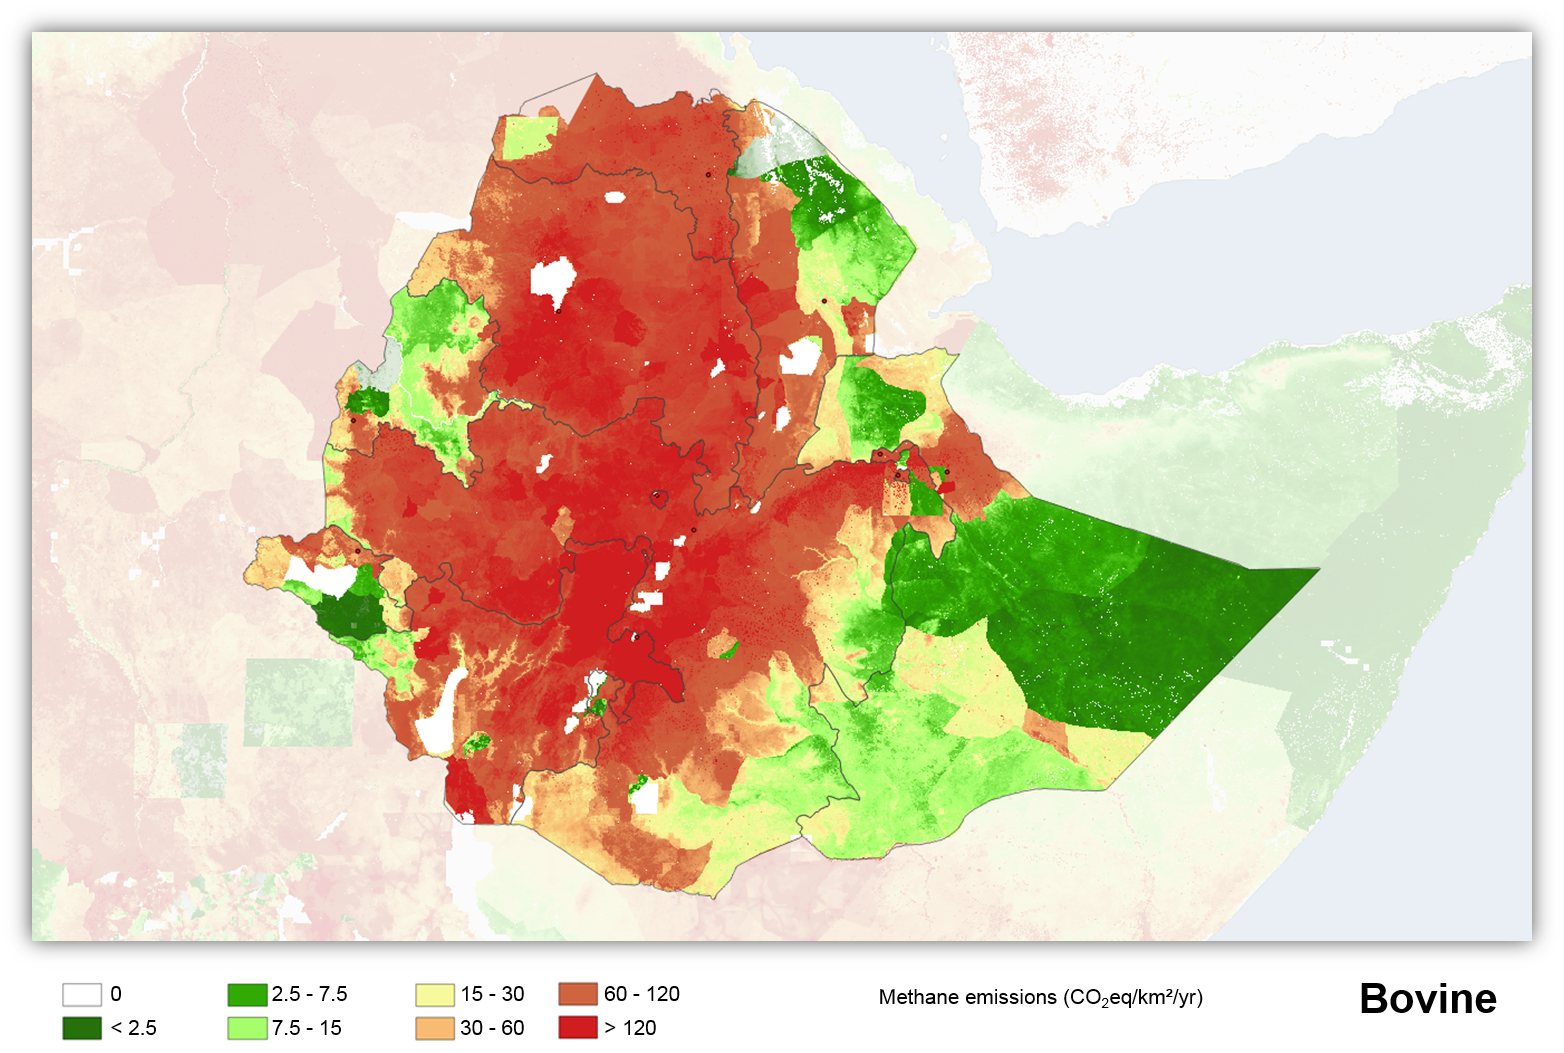
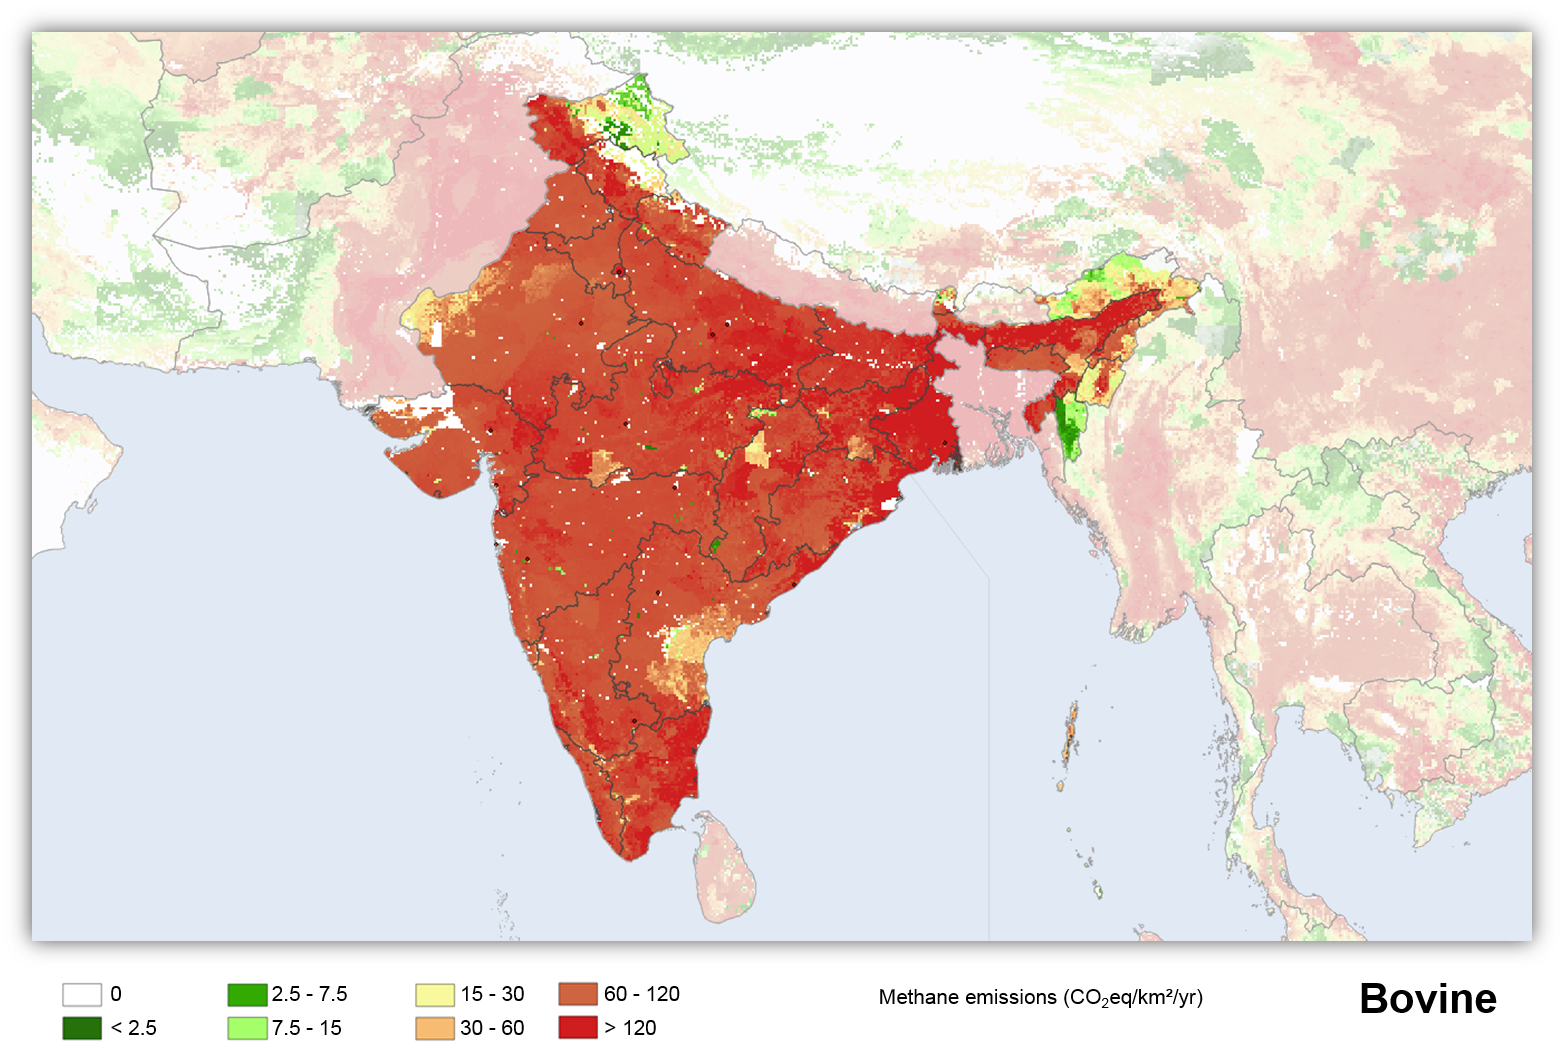
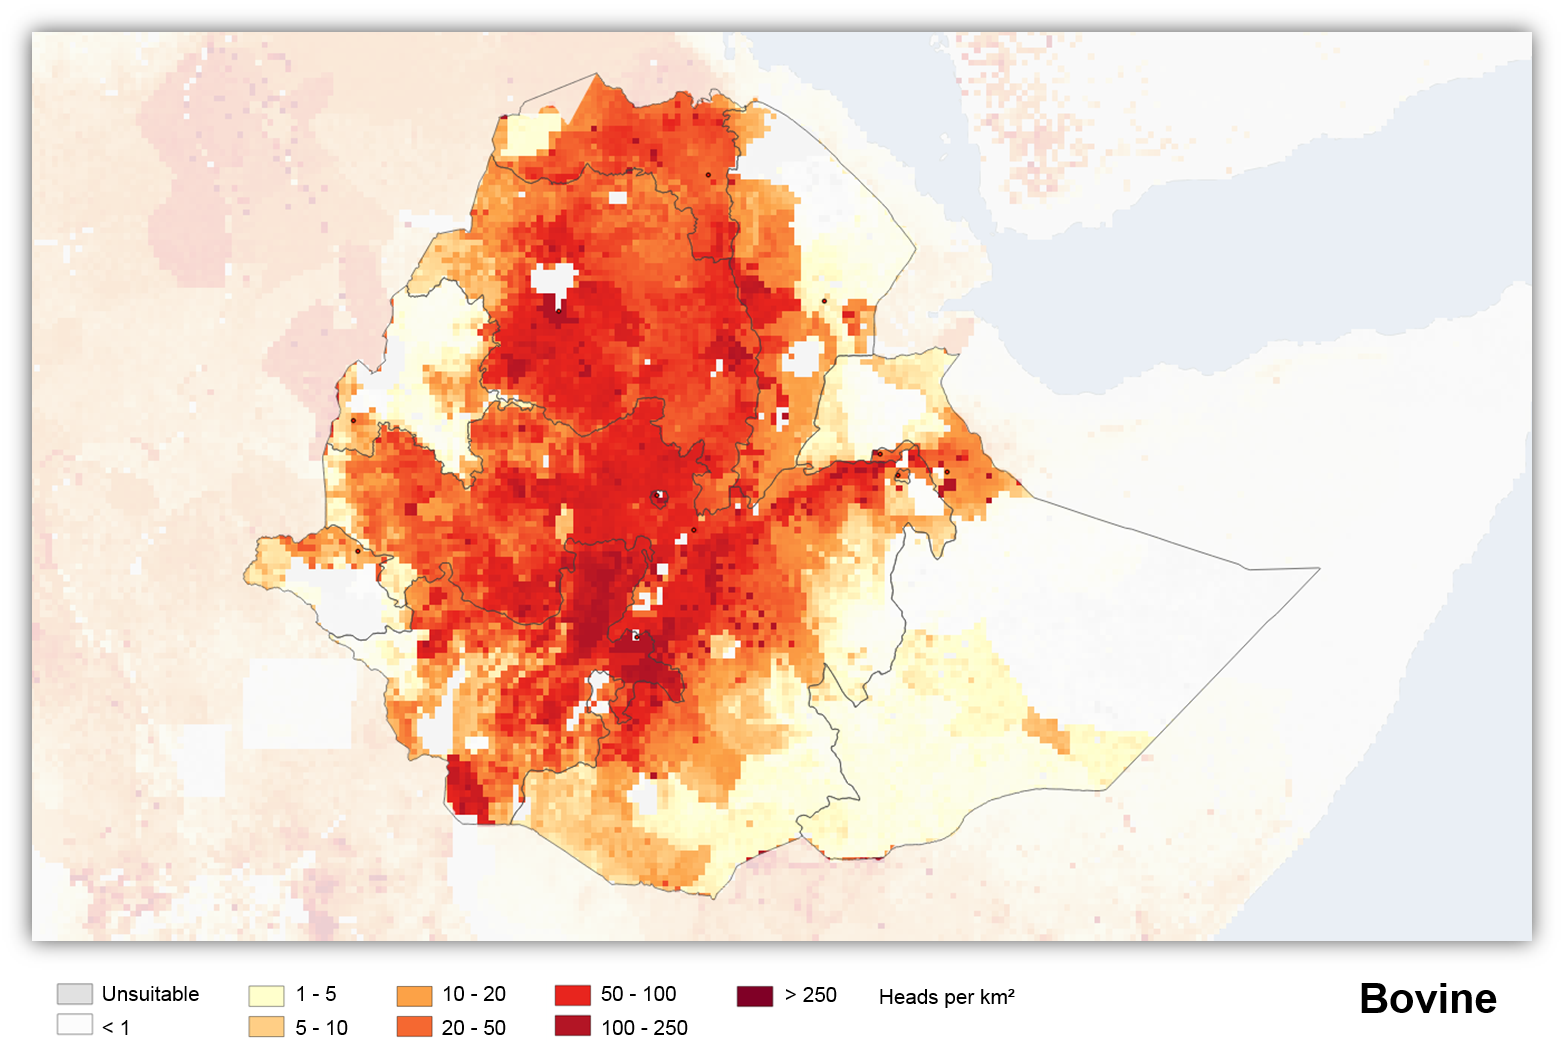
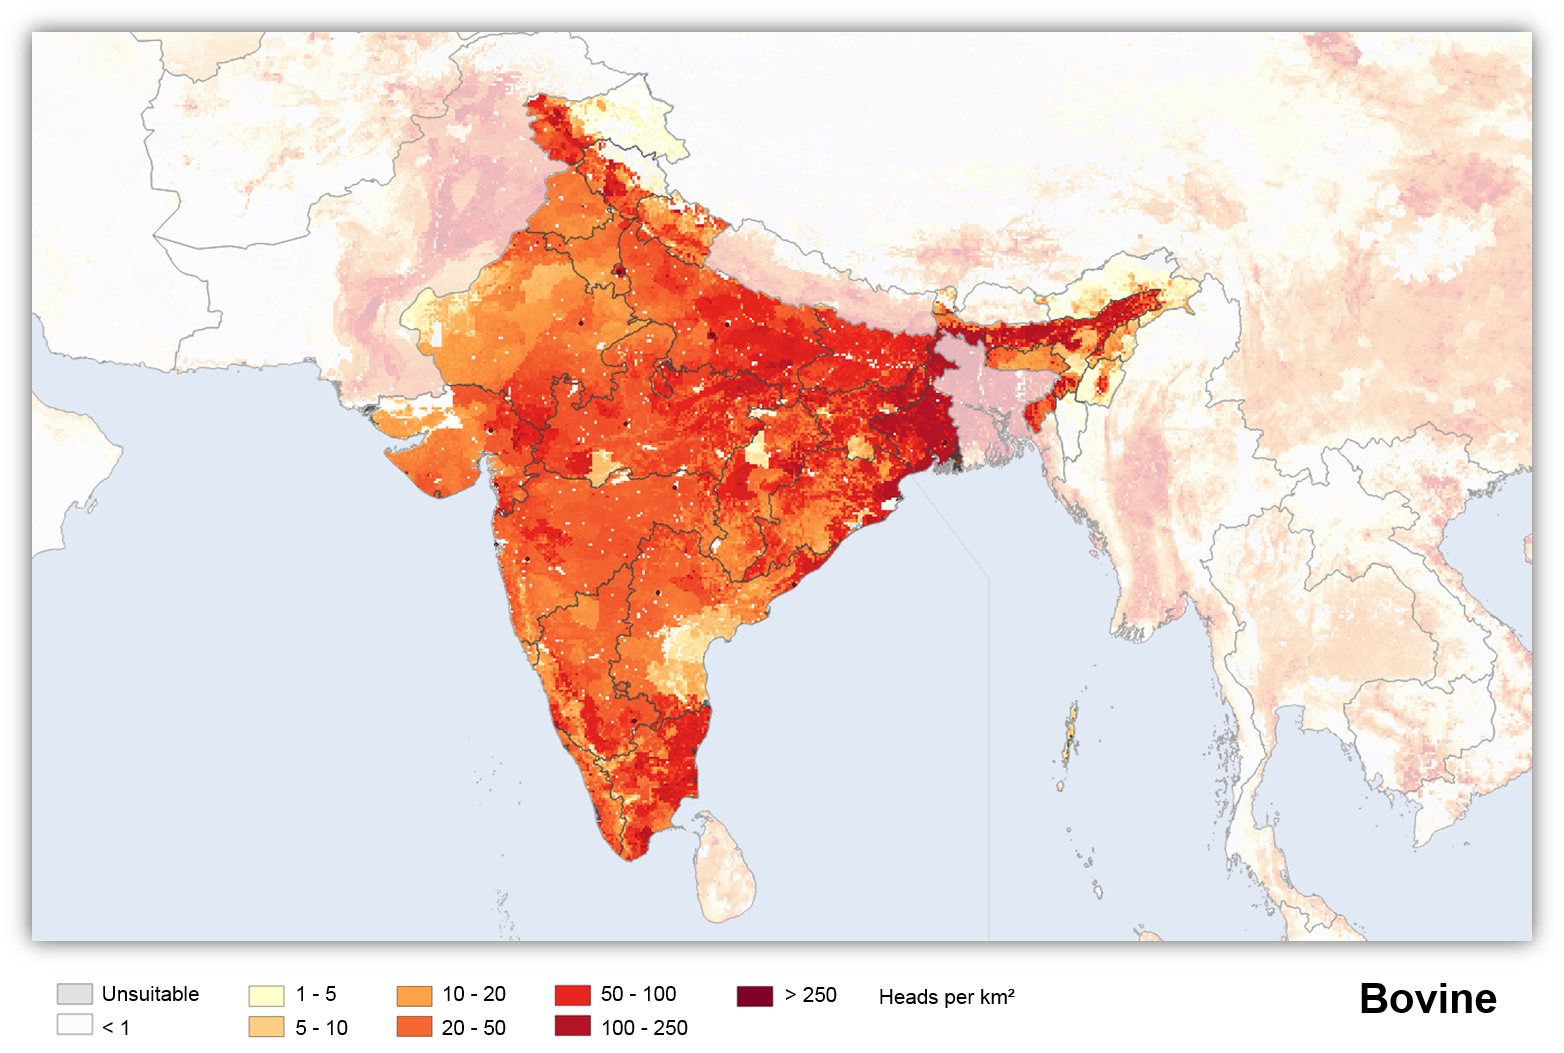
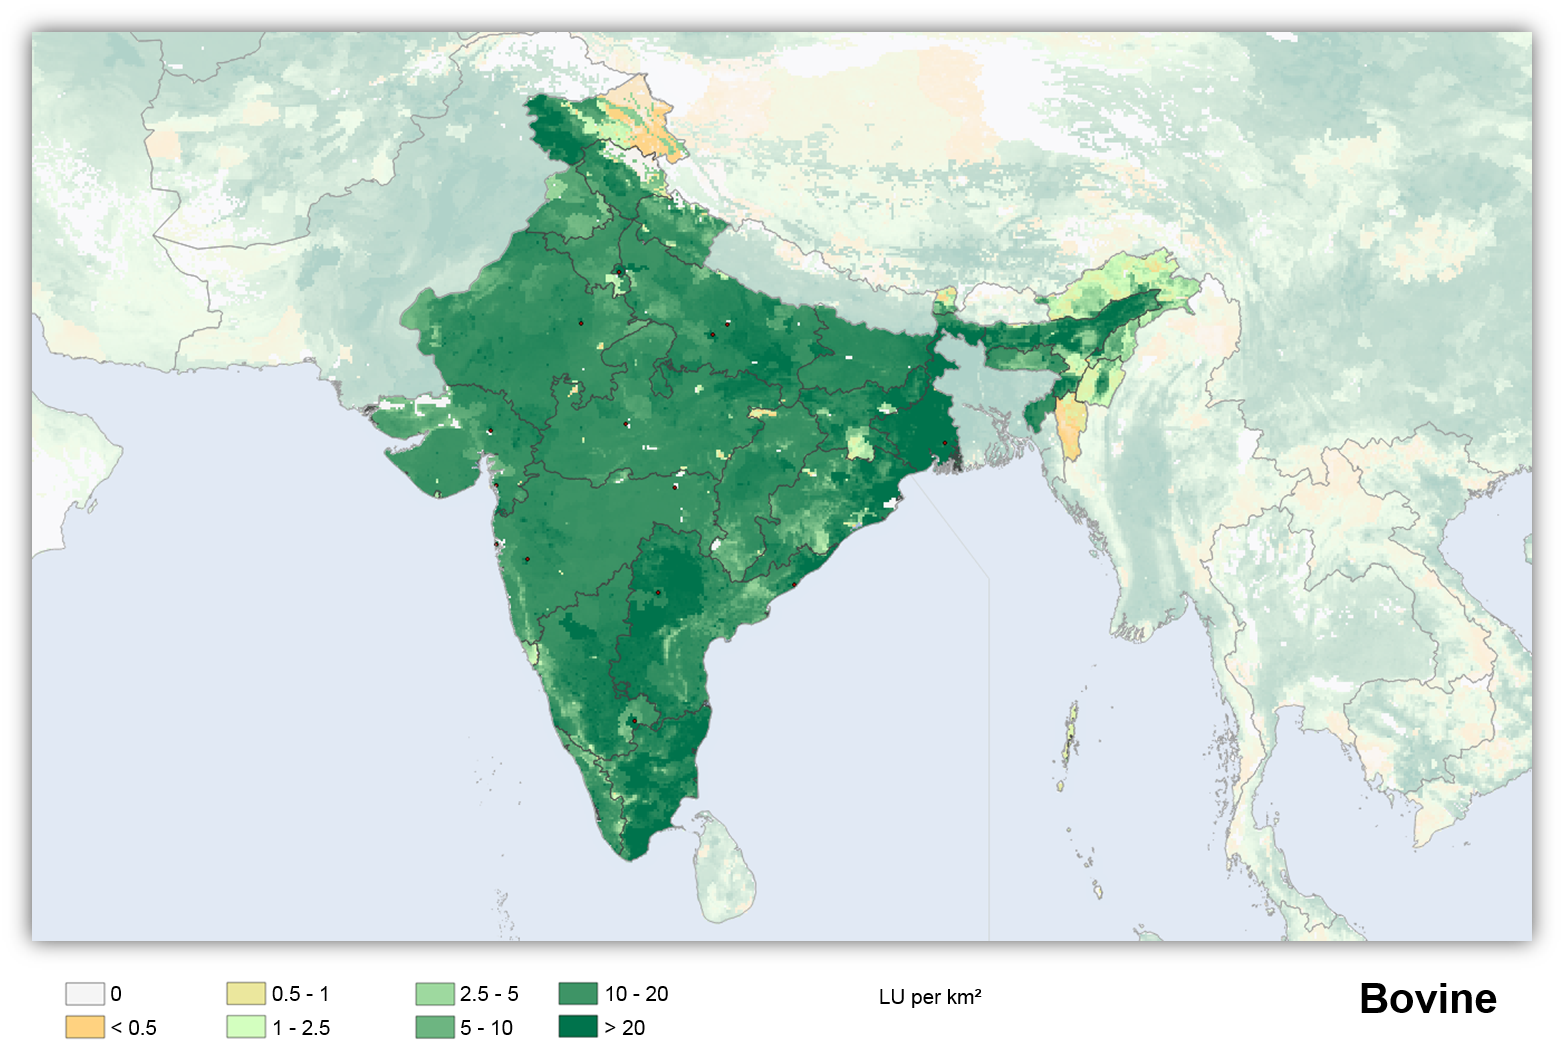
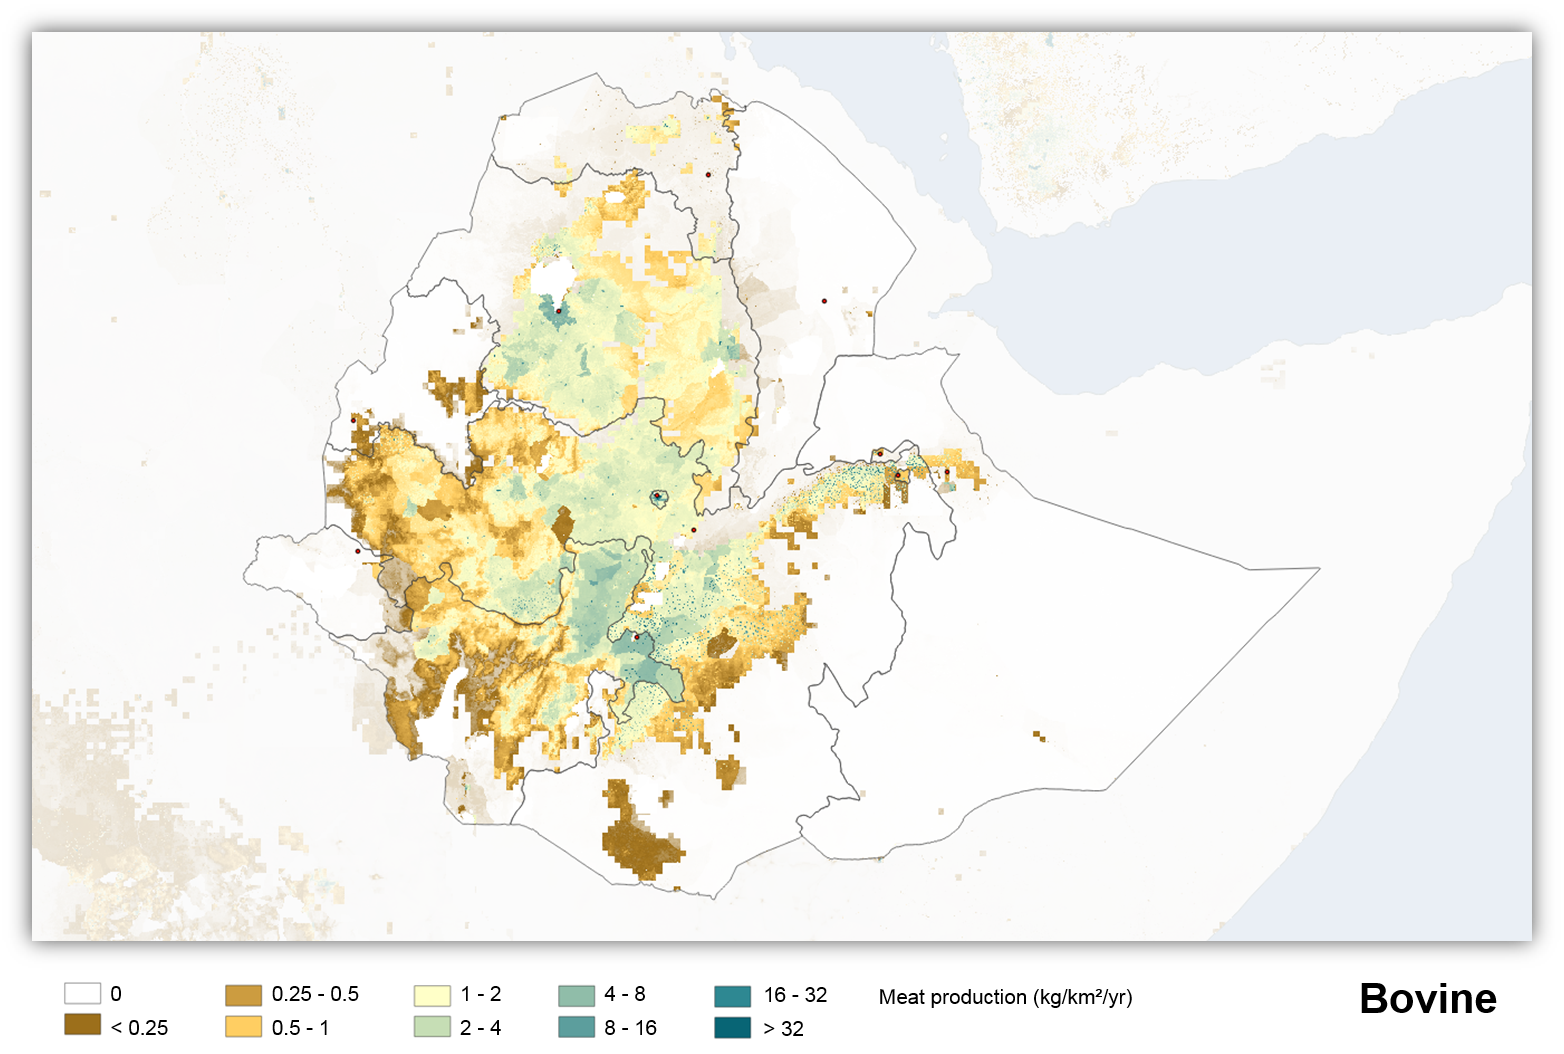
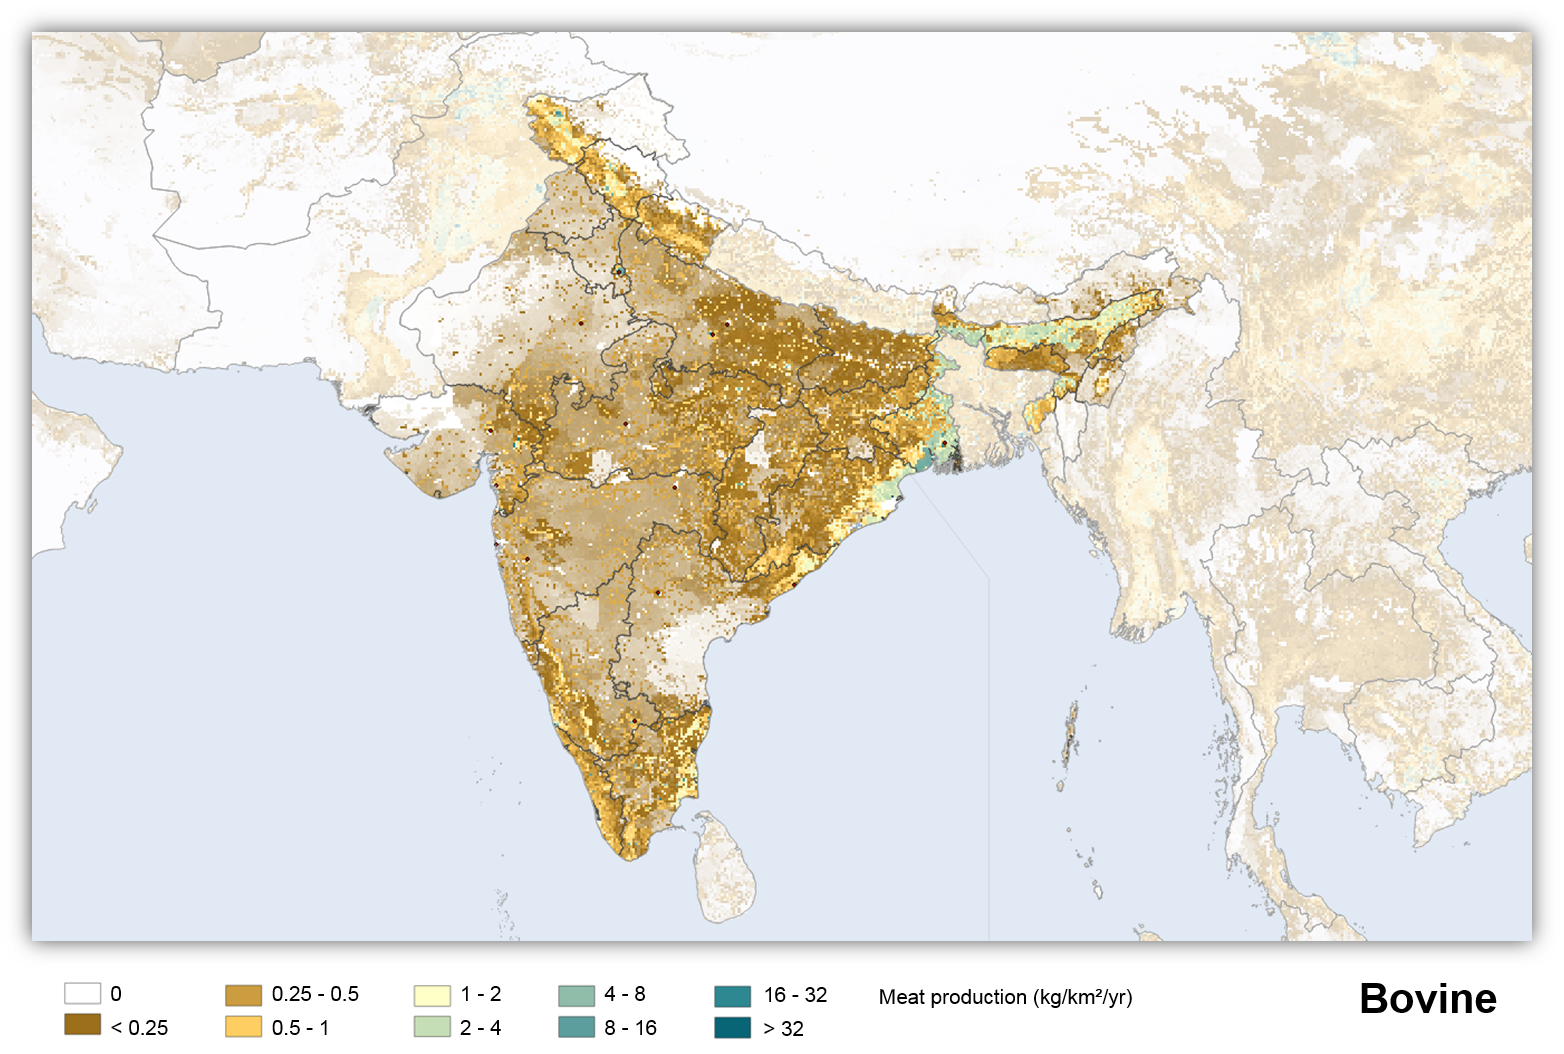
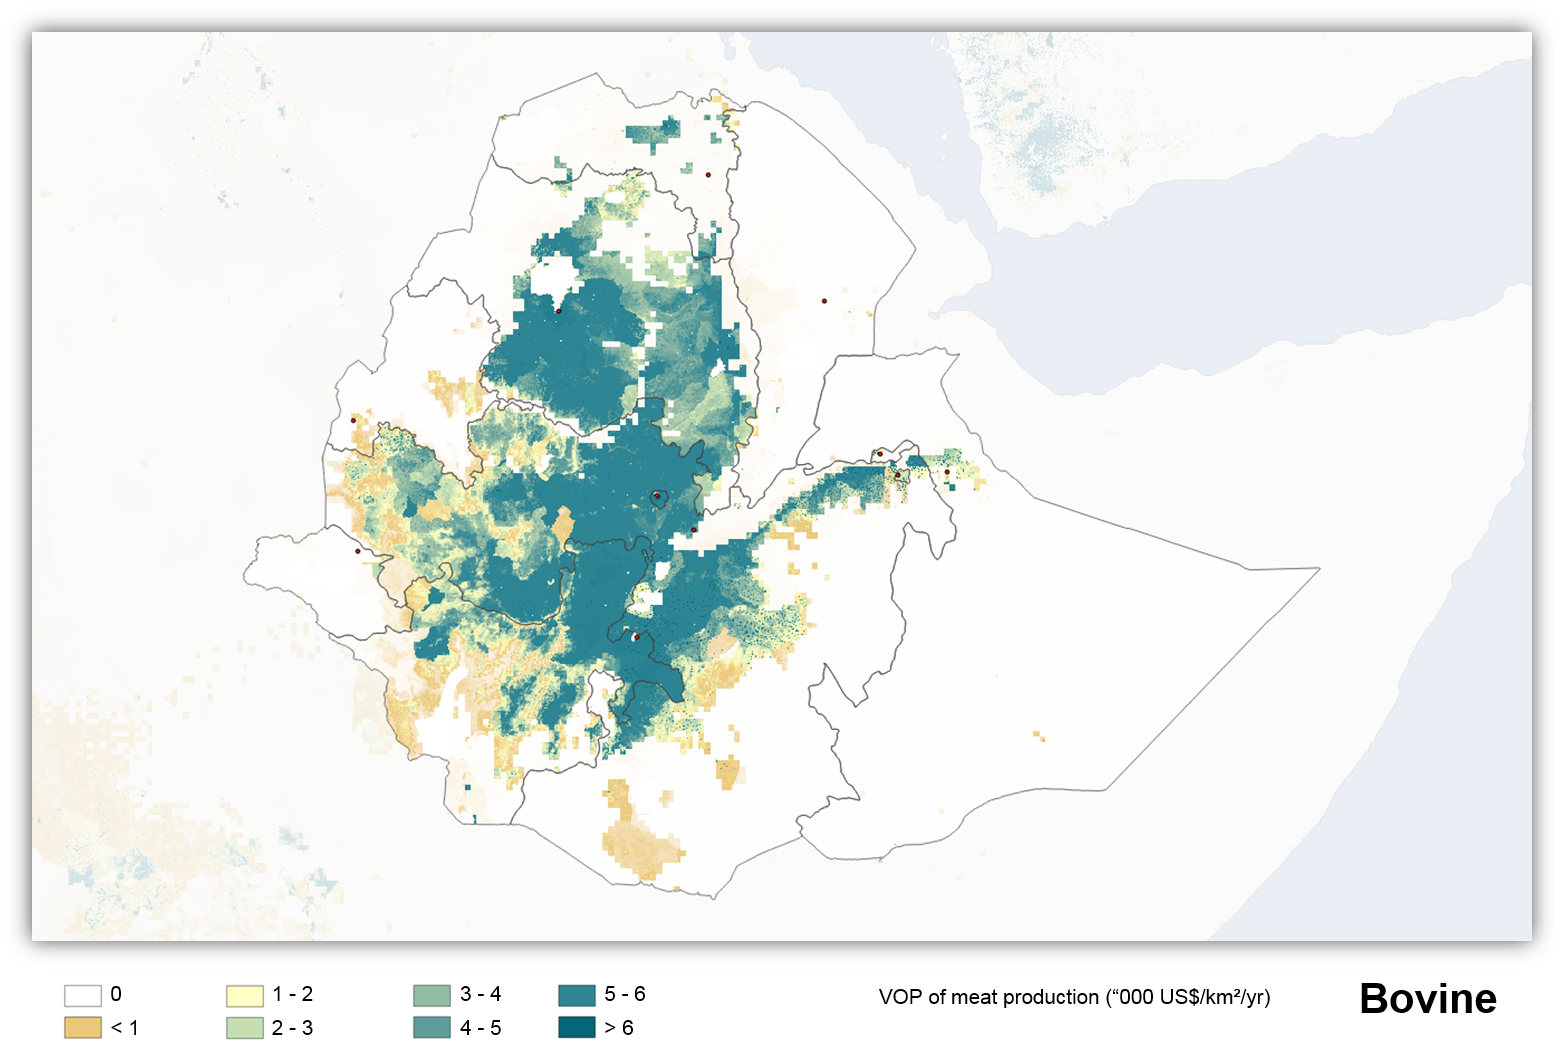
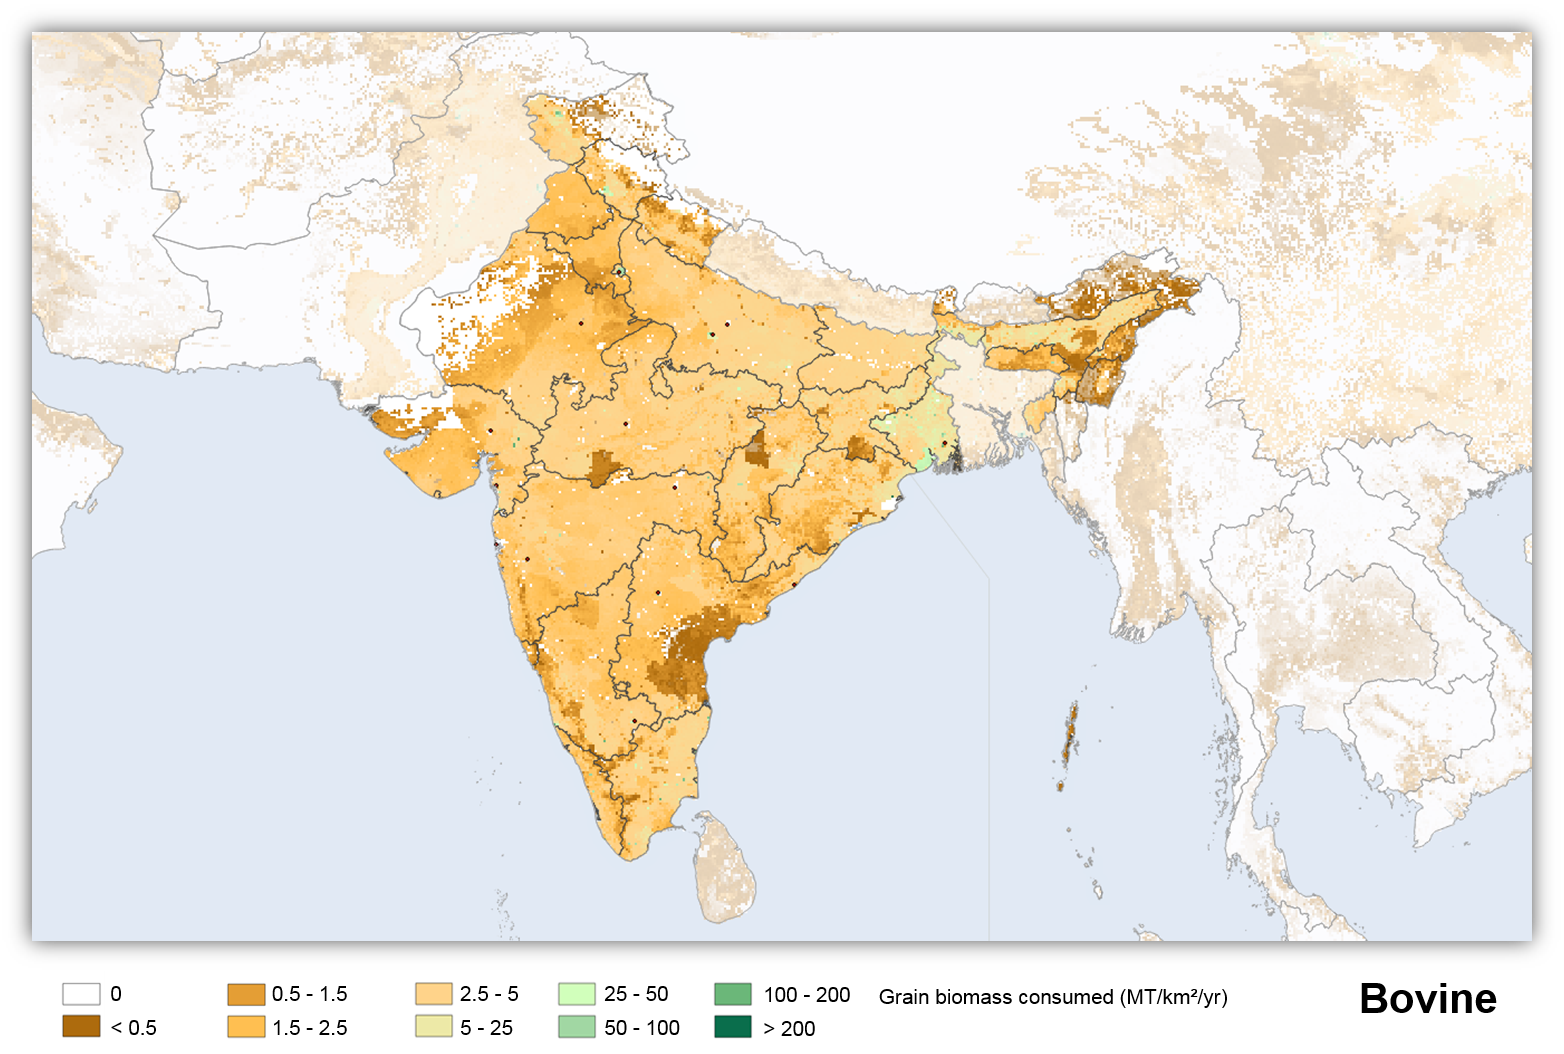
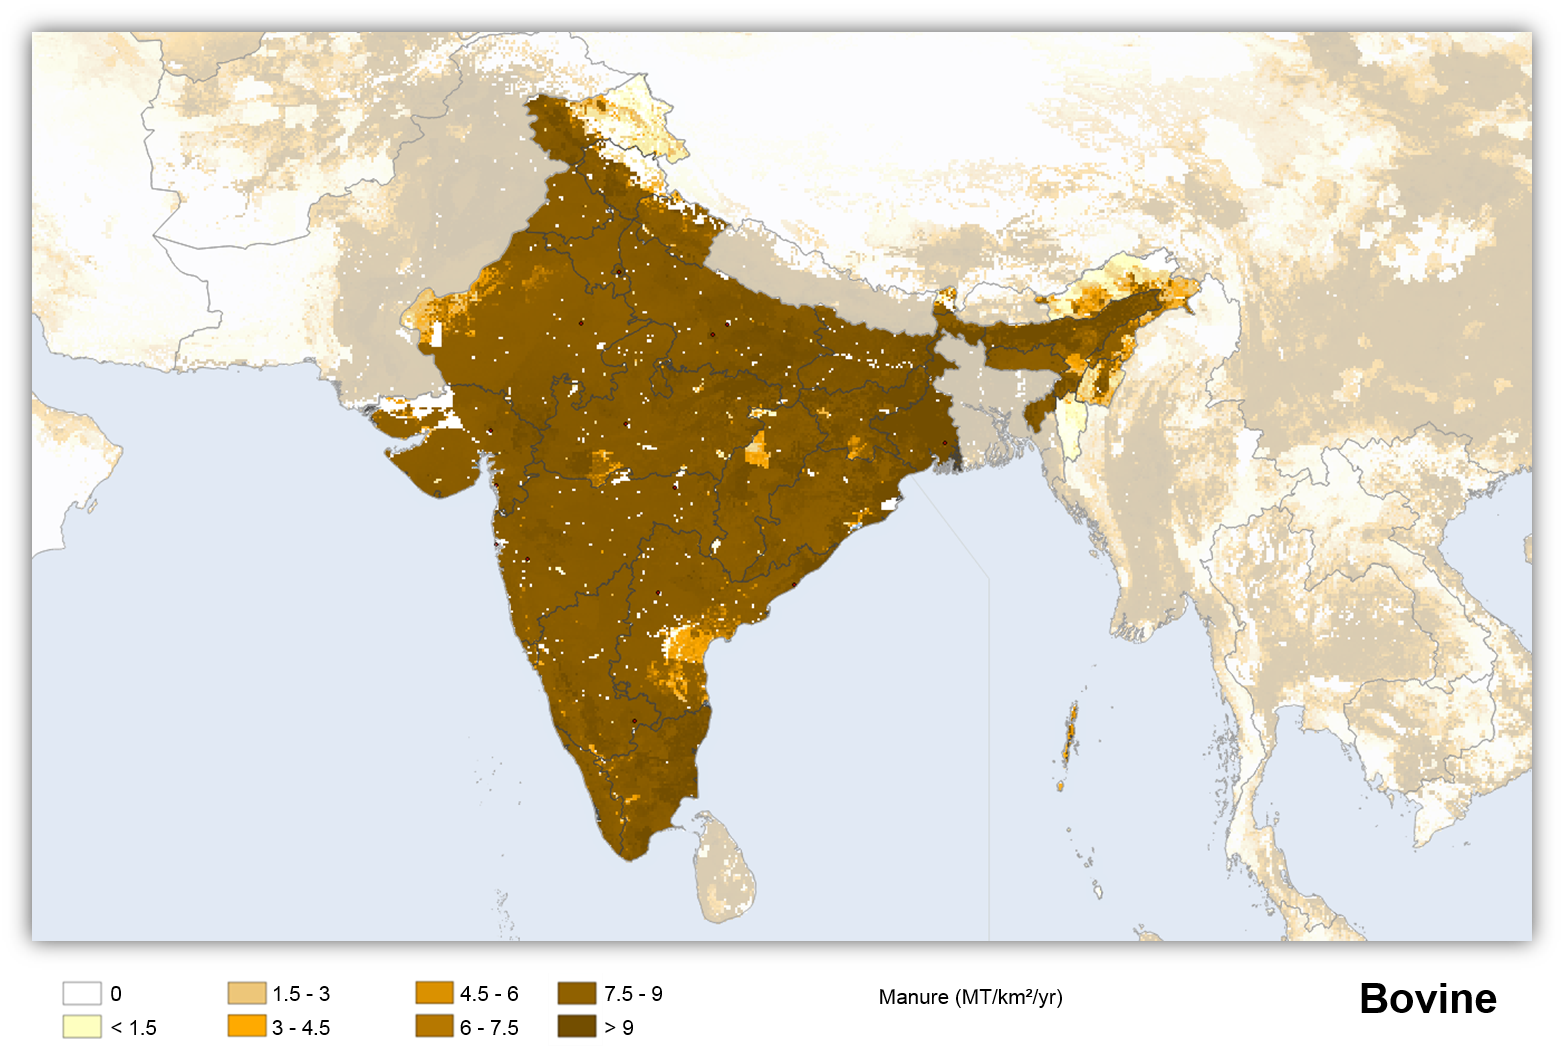
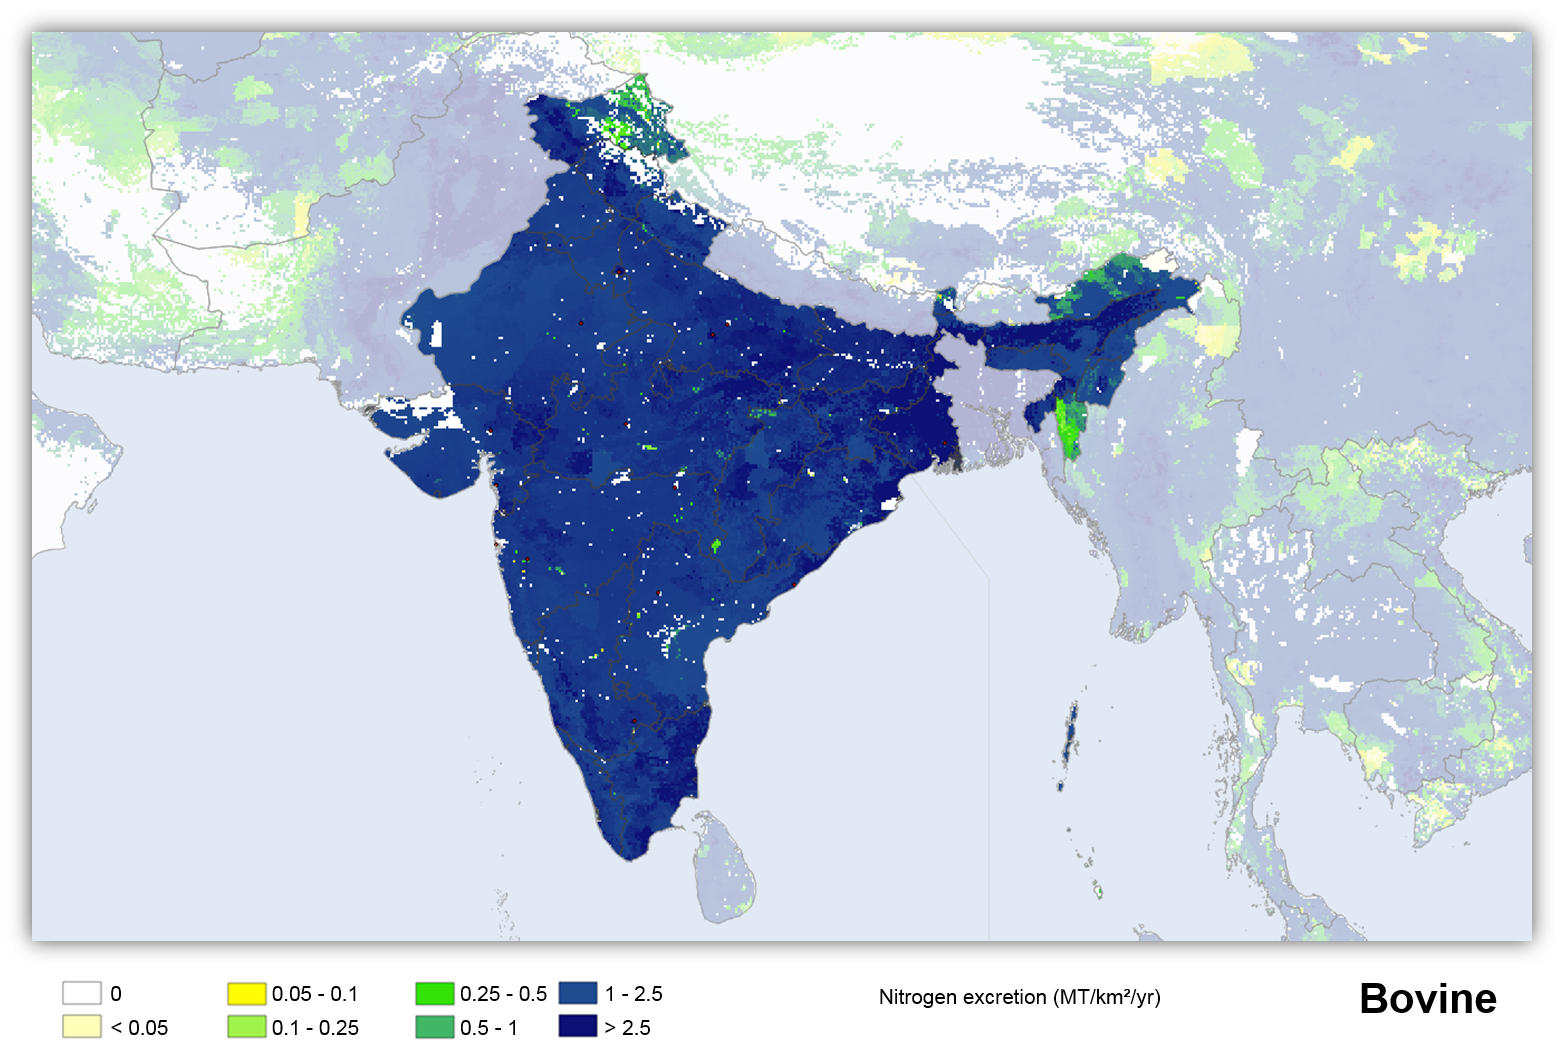
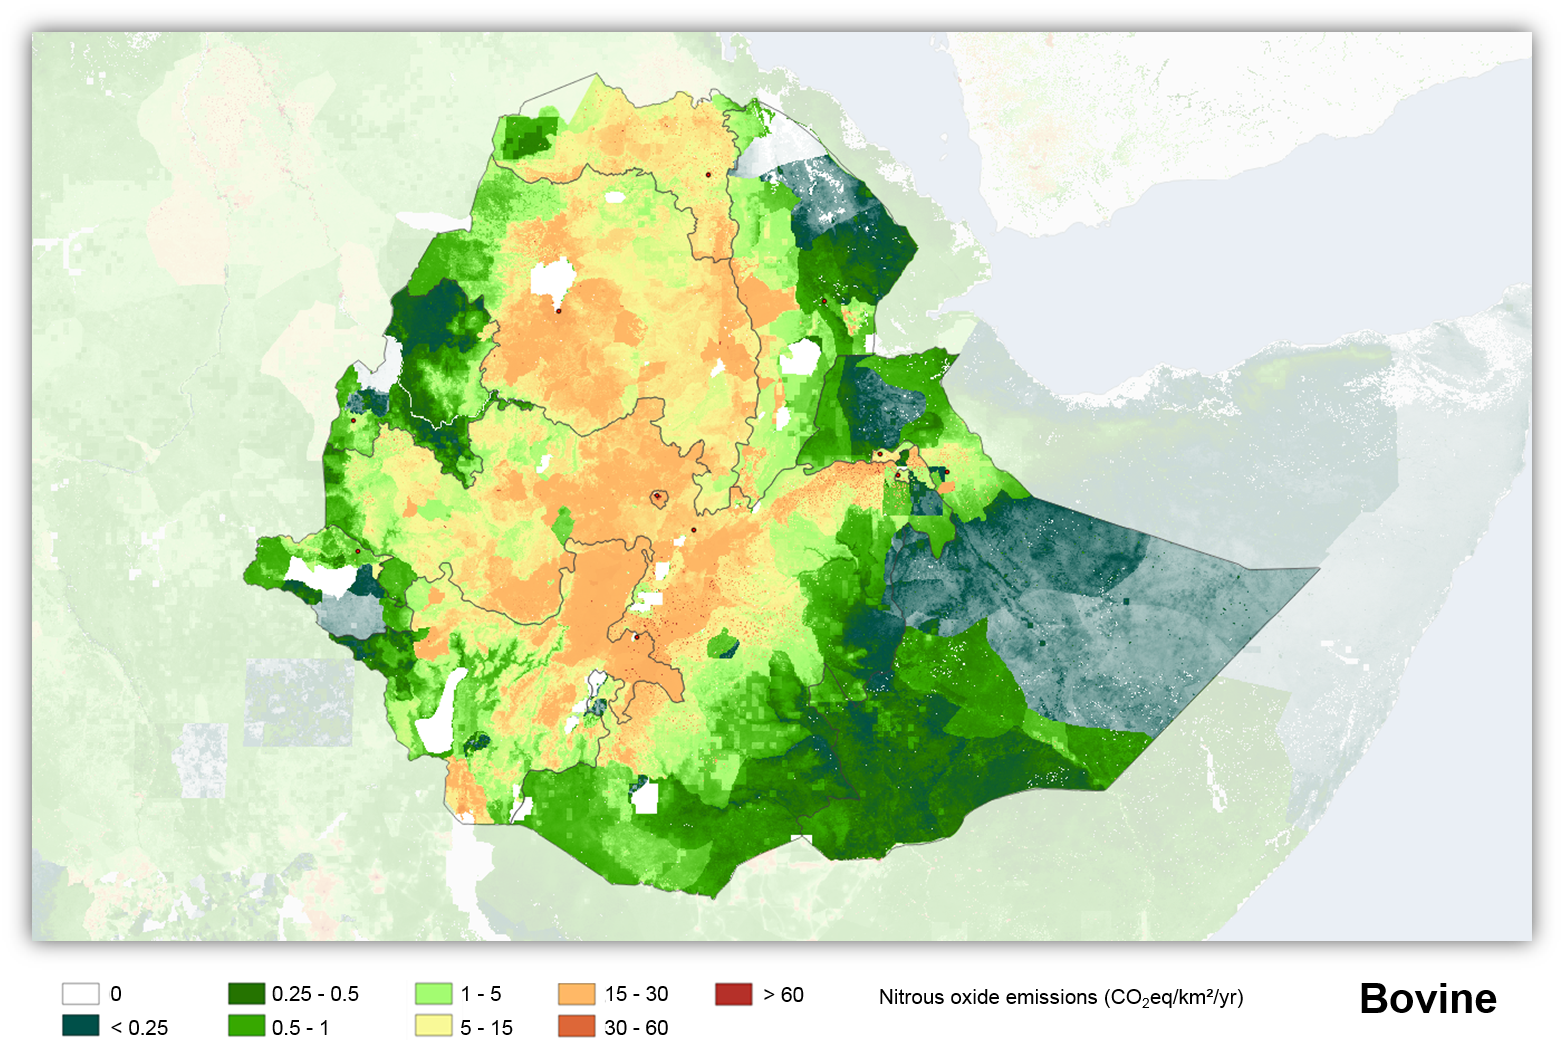
Using the data and tools described in the ‘Resources’ page, we have generated maps highlighting baseline data for bovine, sheeps and goats, poultry and all livestock production in Ethiopia and India for 2010. For each of these commodities the following maps were generated:
Heads per km2
Livestock Unit per km2

Meat production (kg/km2/yr)
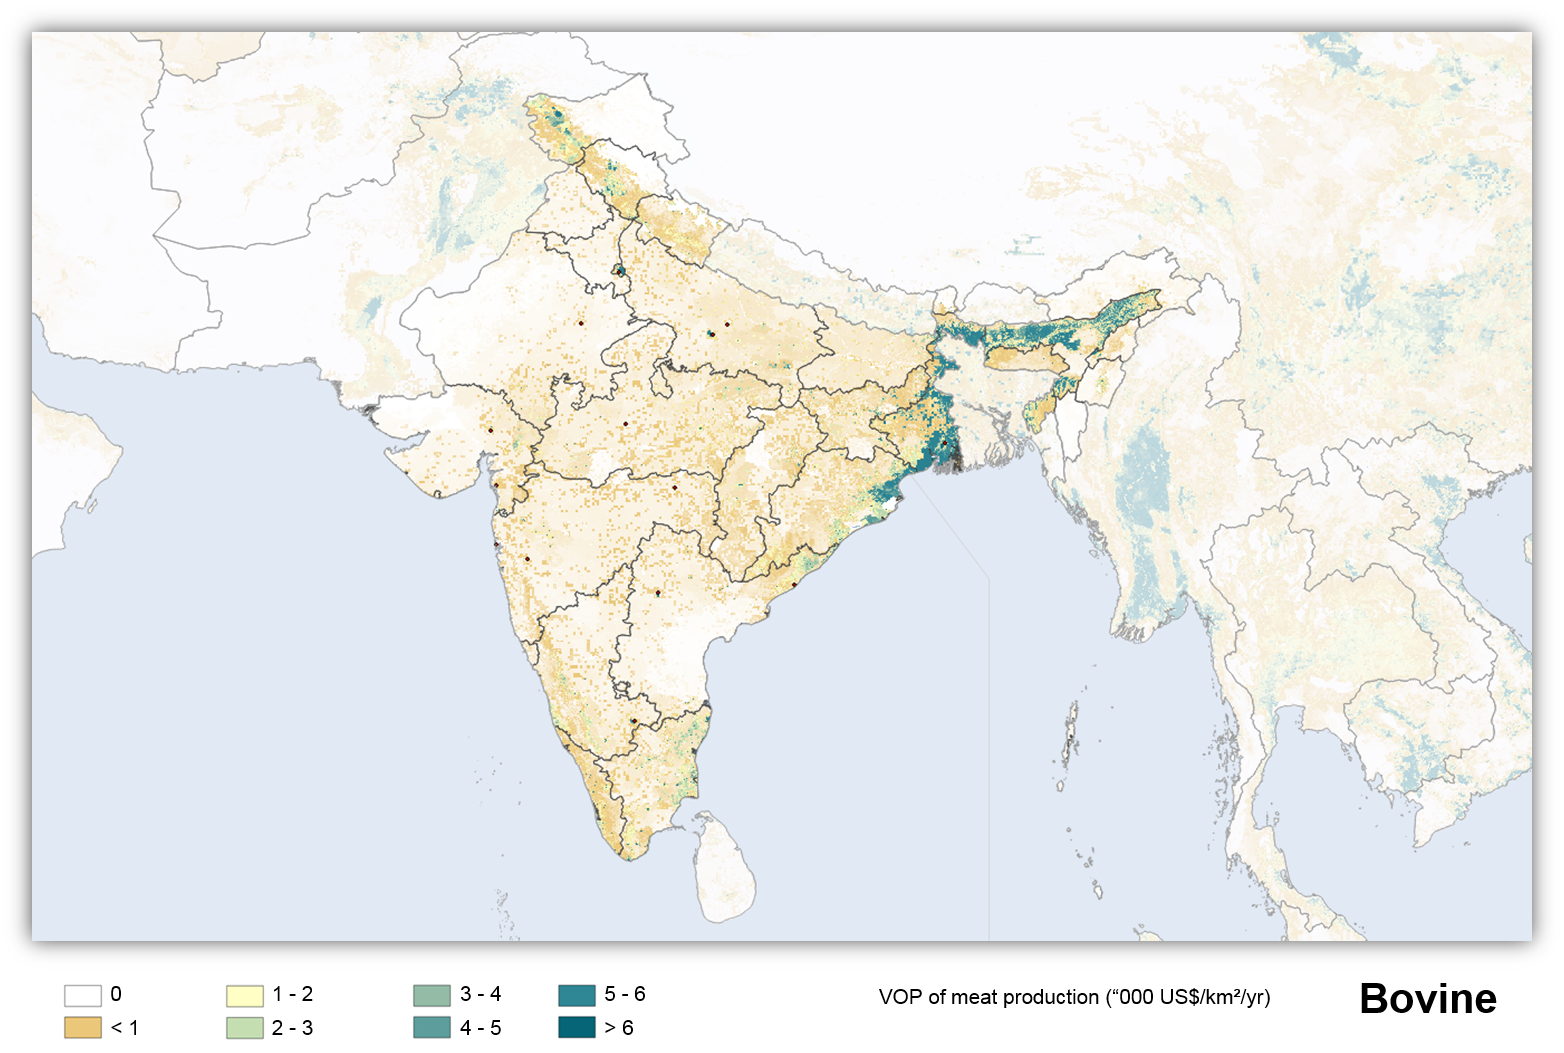
VOP of meat production ($US/km2/yr)
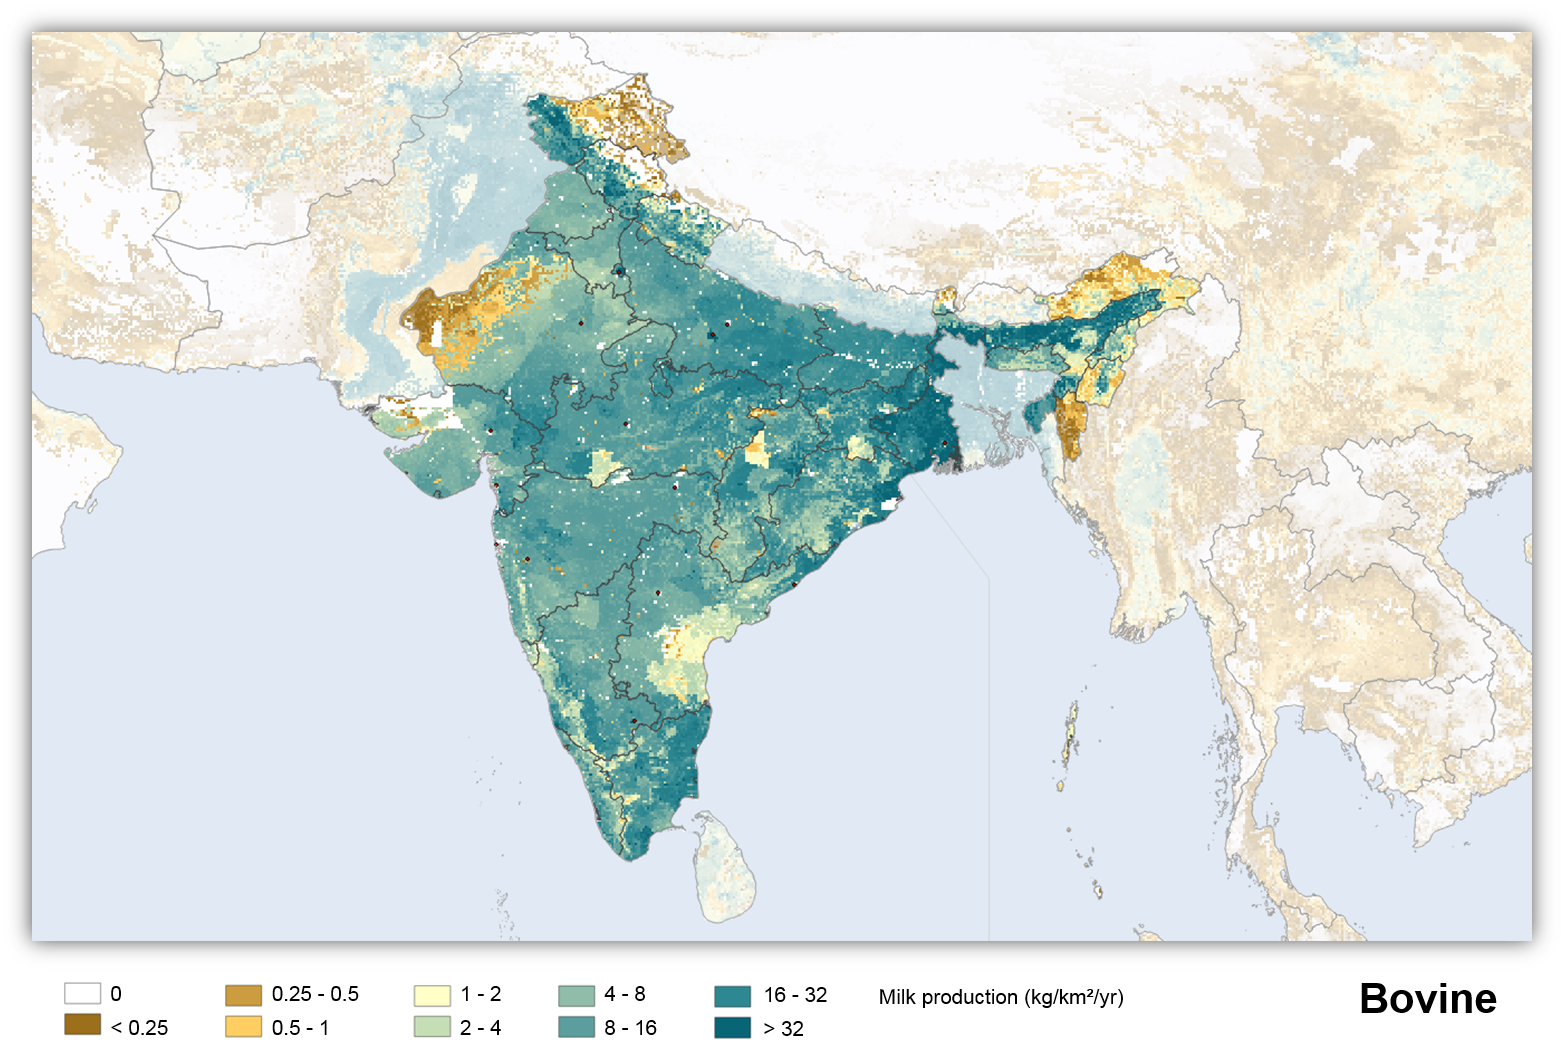
Milk production (kg/km2/yr)

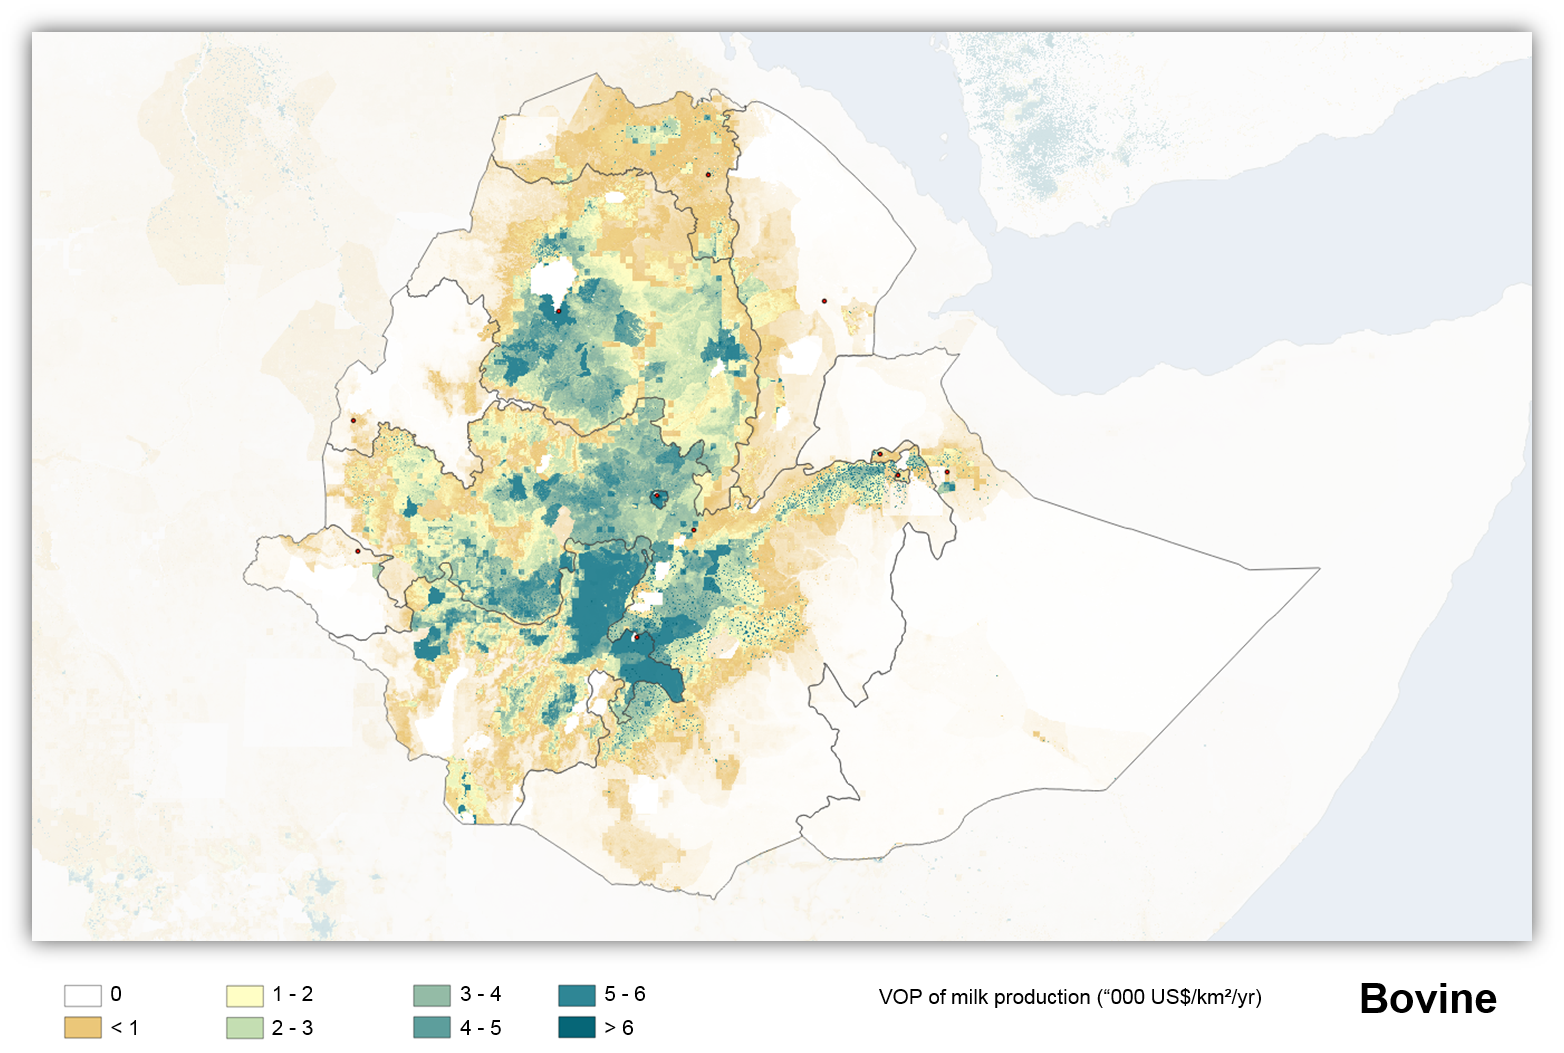
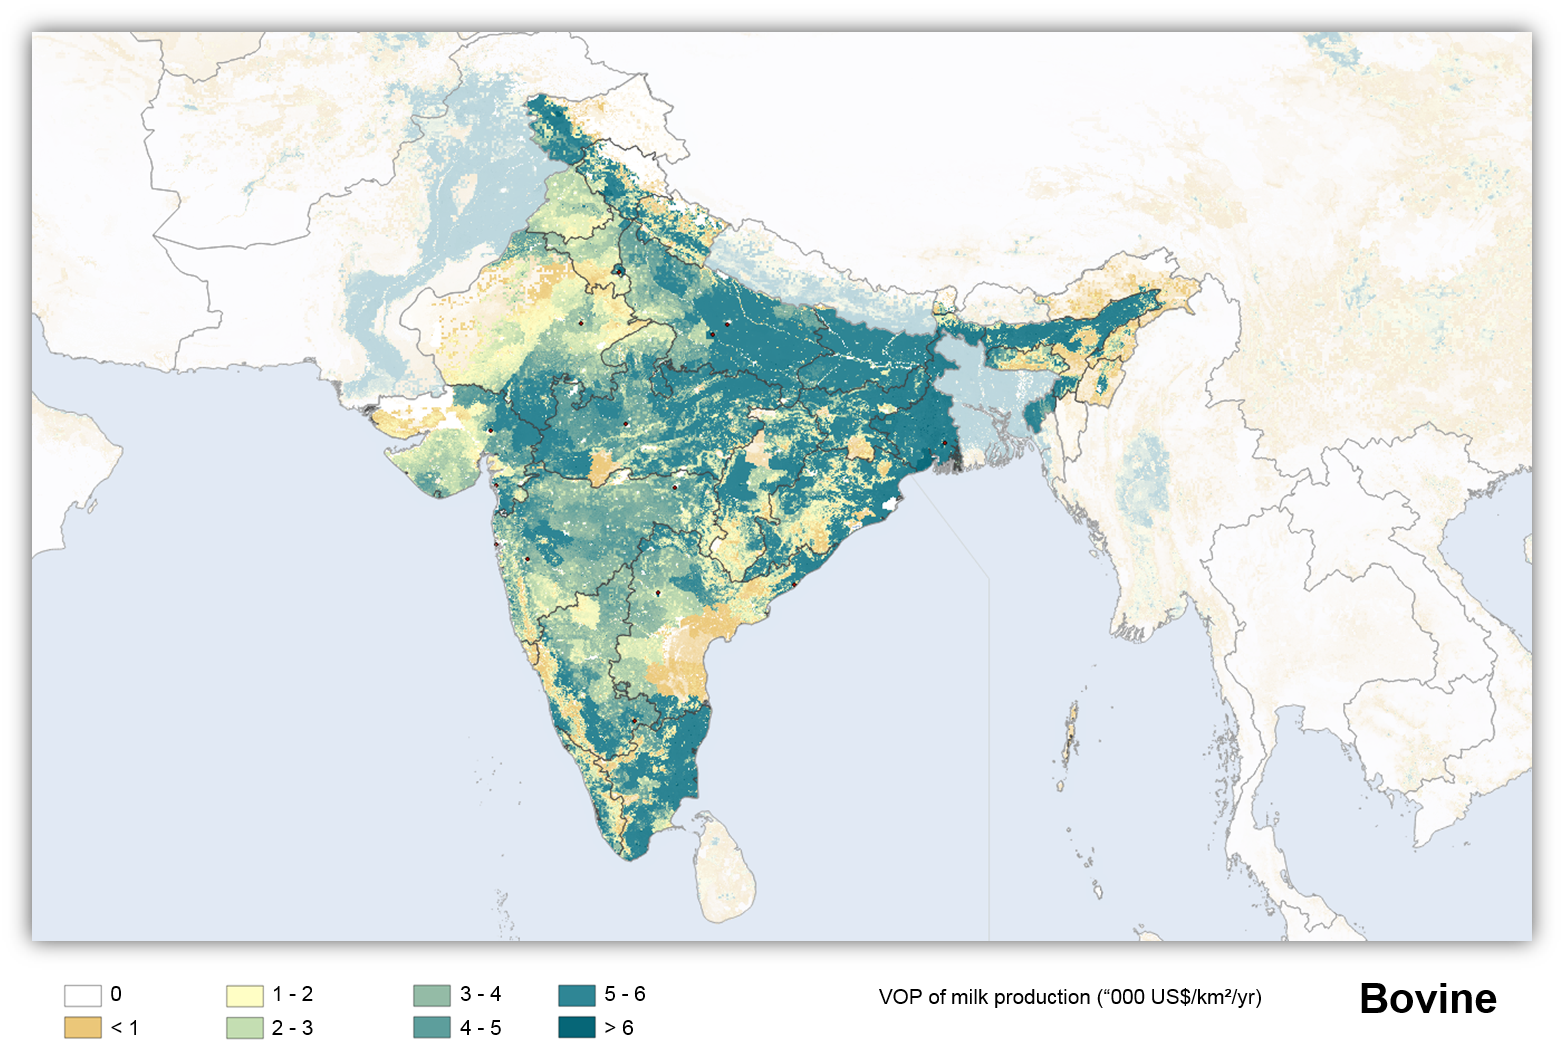
VOP of milk production ($US/km2/yr)
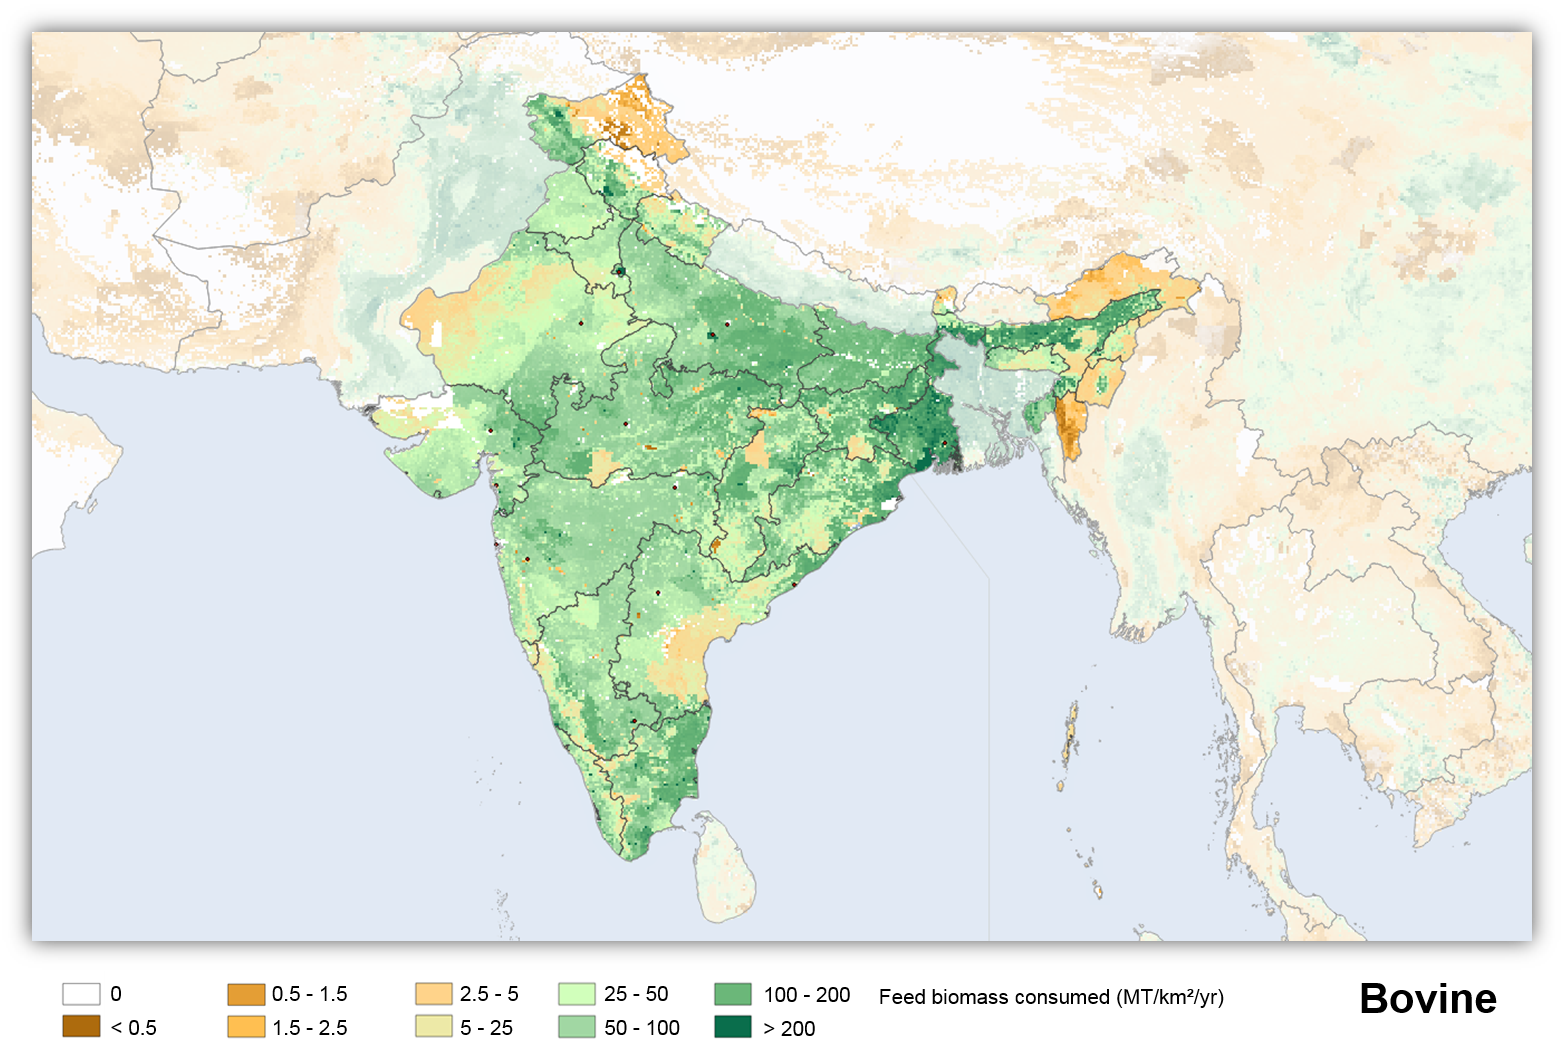
Feed biomass consumed (MT/km2/yr)

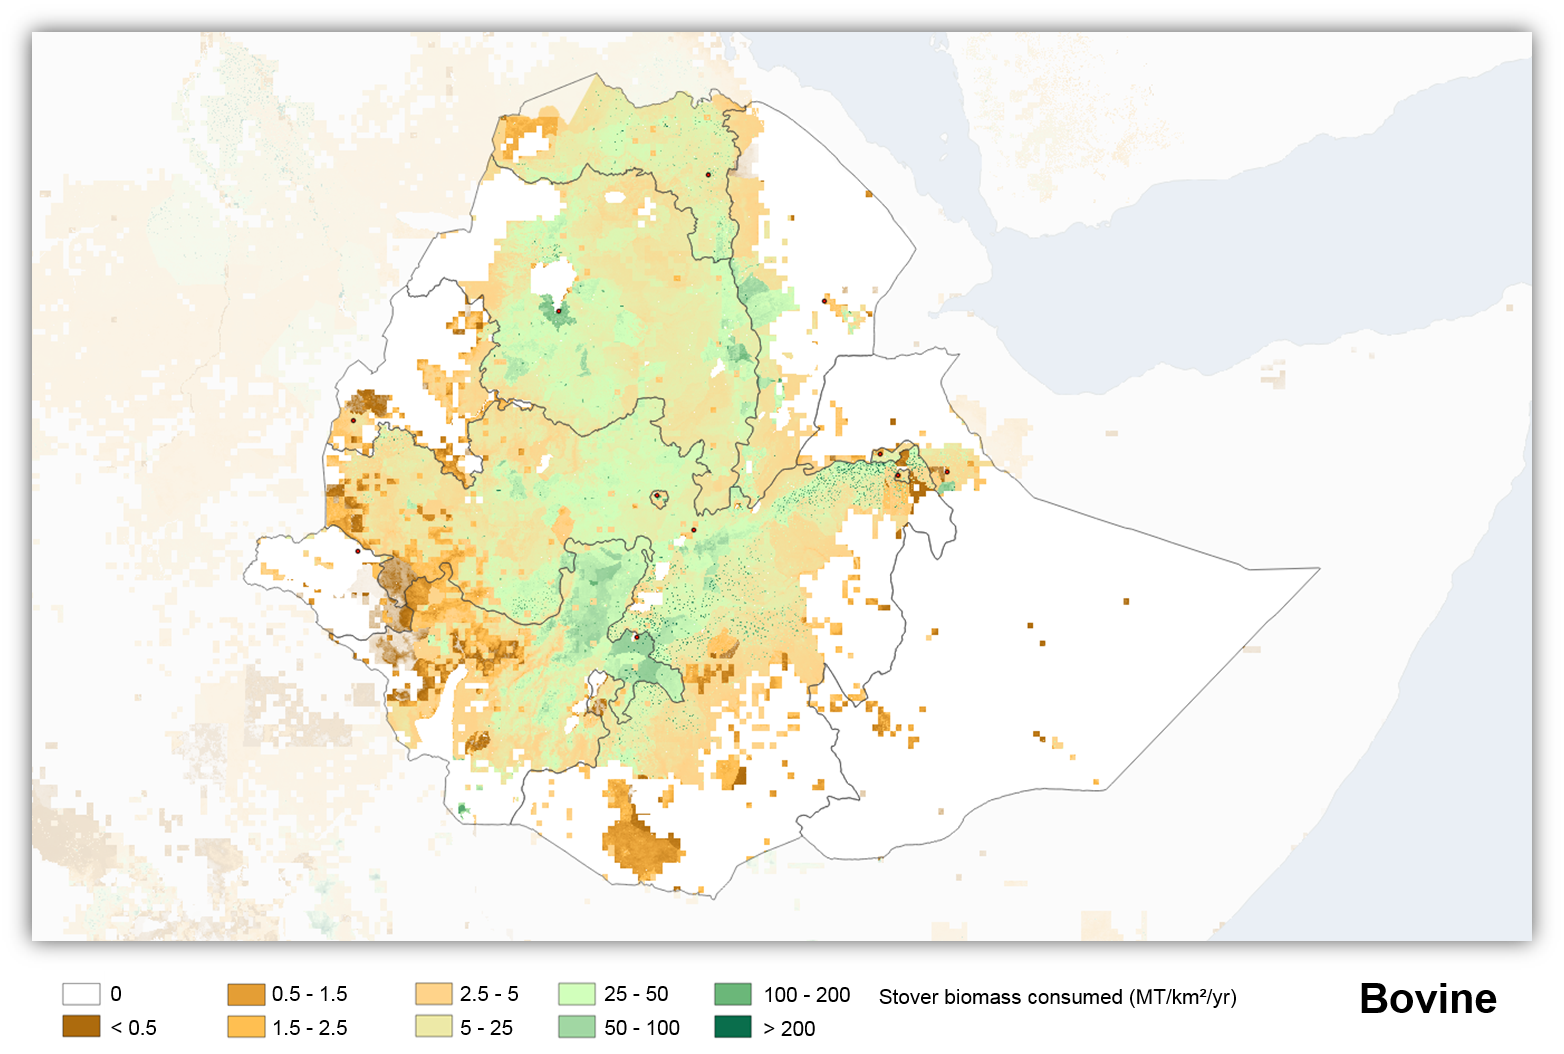
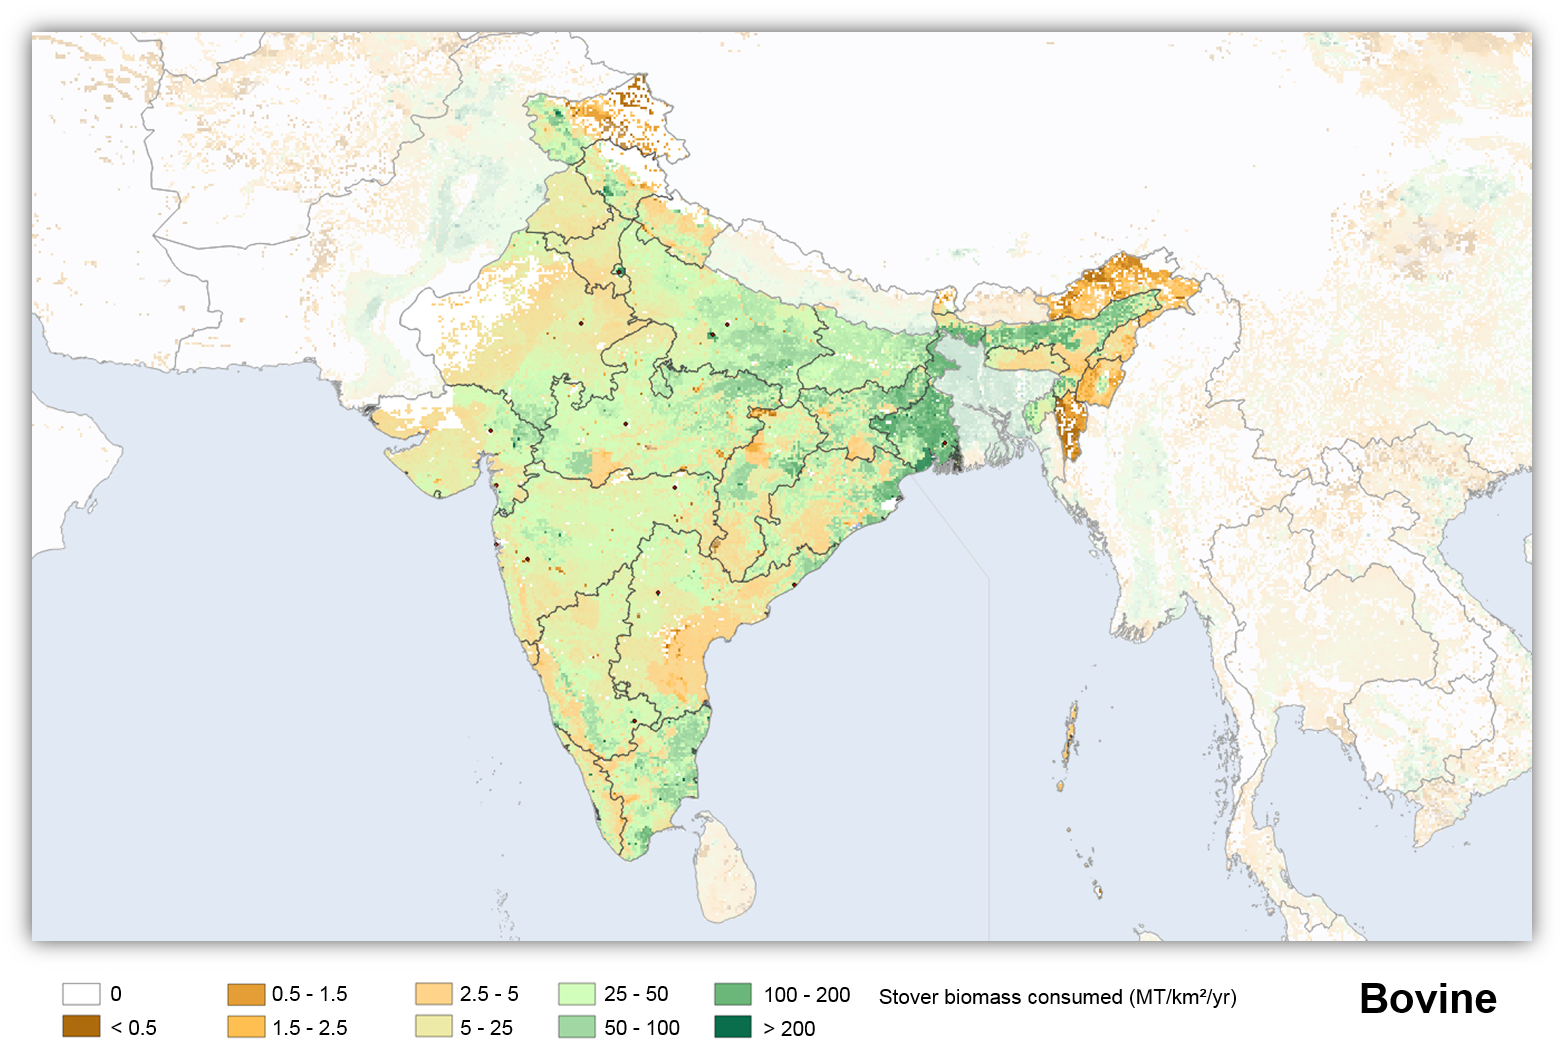
Stover biomass consumed (MT/km2/yr)
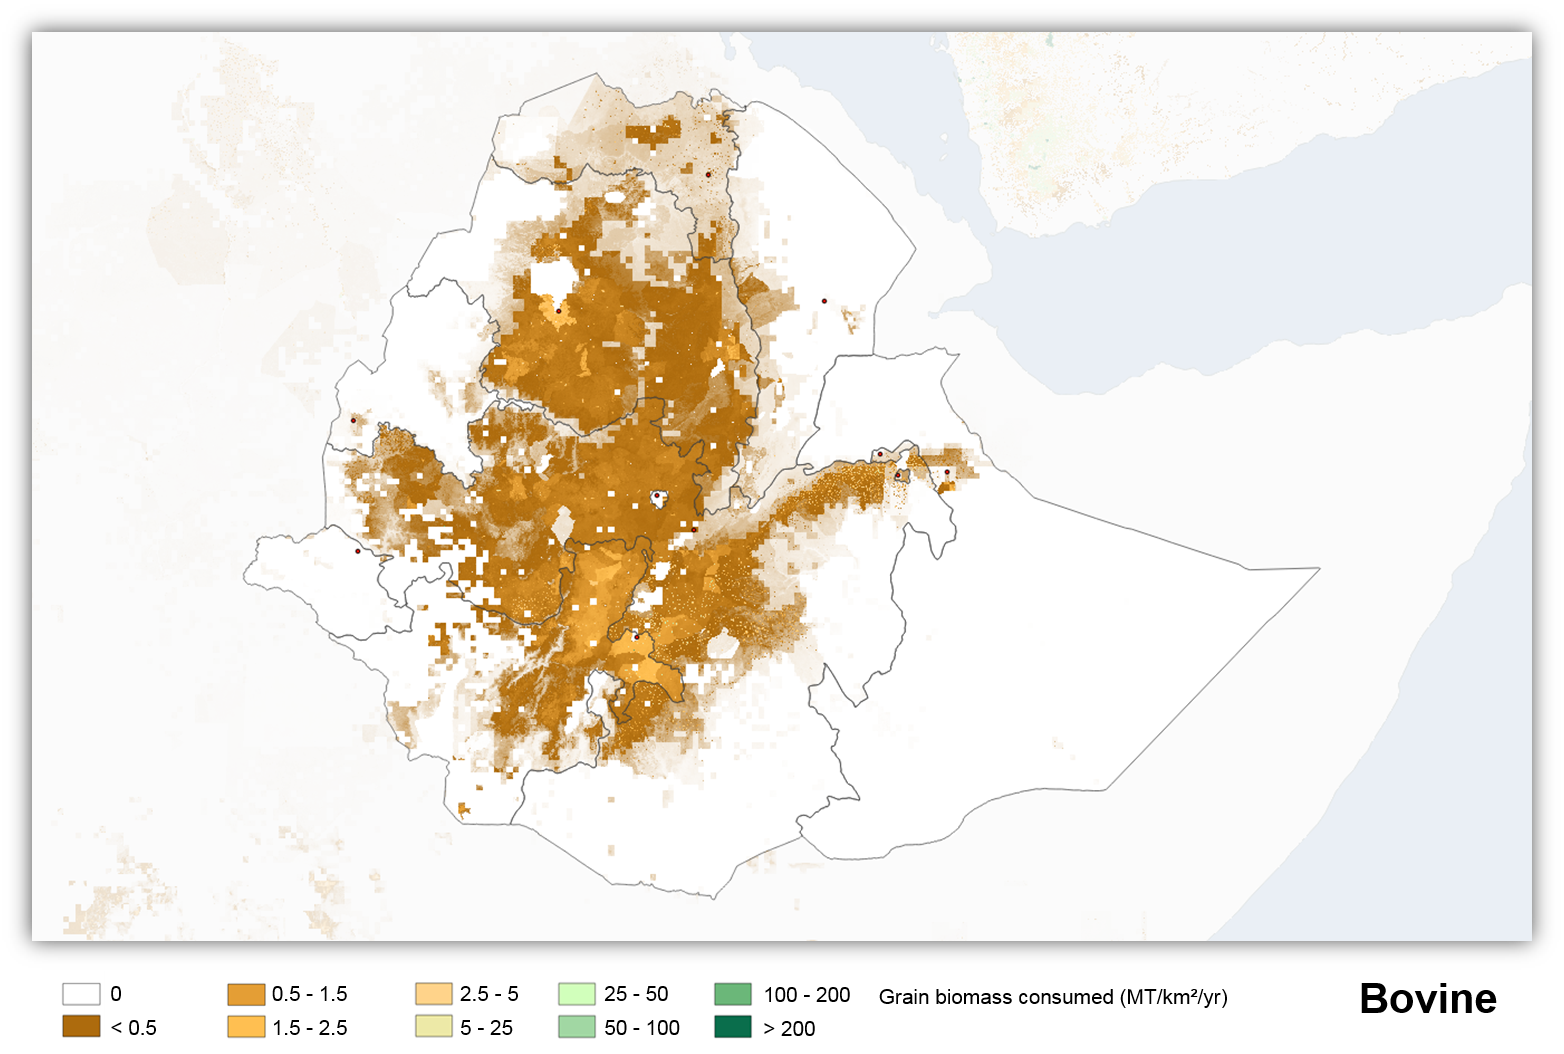
Grain biomass consumed (MT/km2/yr)
Manure (MT/km2/yr)

Nitrogen excretion (MT/km2/yr)

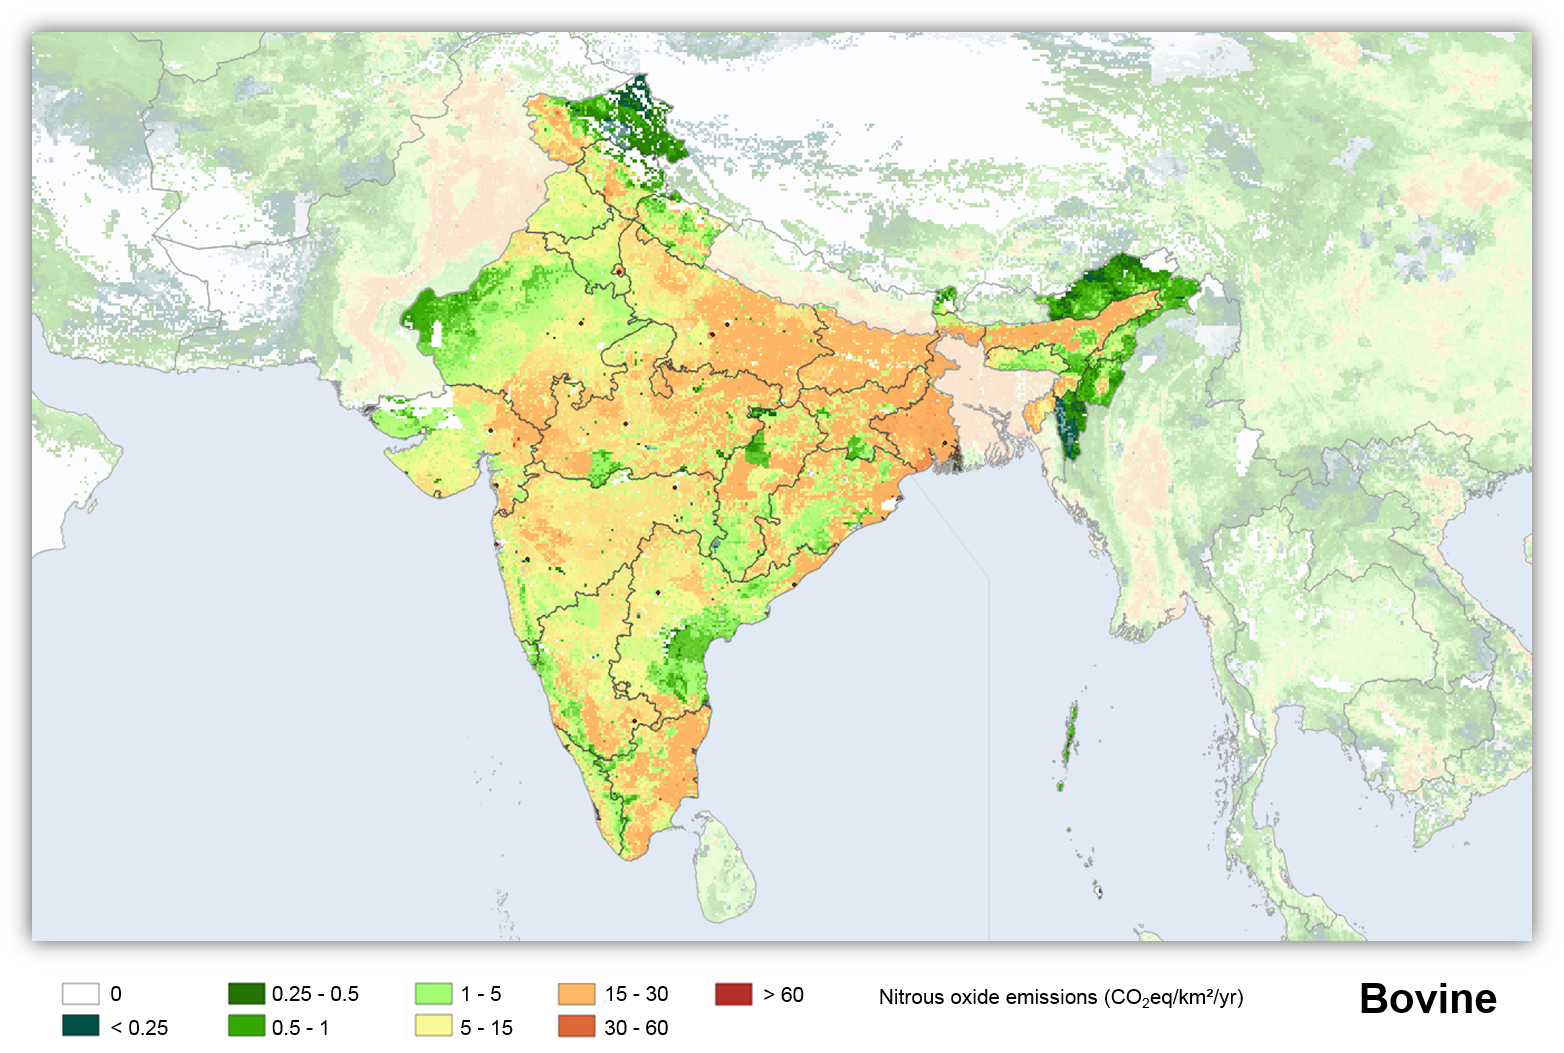
Nitrous oxide emissions (CO2eq/km2/yr)
Methane emissions (CO2eq/km2/yr)