Day 16: Mapping the unknown
By Olivia Belshaw
On board the RV Investigator a group of scientists collect extensive data to map the sea floor – the process of determining the depth of the ocean floor at different points is called bathymetry. Approximately only 4% of the sea floor on Earth has been mapped – we actually know more about the surface of the moon than the surface of the seafloor underneath the oceans.
In order to map the sea floor, the scientists use a process called swathing. Swathing uses sound (SONAR technology) to determine the depth of the sea floor at various points to generate a 3D map of the sea floor. The ship sends sound waves down to the sea floor every 10 seconds. These waves travel to the bottom of the ocean and then are reflected back to the ship where 512 receivers collect the time taken for the sound to travel from moment of release to return. There are 512 soundings every 10 seconds and the information is changed into electronic data by computer software so the scientists can use it. The outer sound beams are typically angled away from the ship, so a typical swath also has a width of approximately 4x the depth of the water it is mapping i.e. 1km water depth means 4km swath width.
In order to interpret the sound data obtained (total return time) computer software must take into account a variety of factors – the velocity of the sound in the water column, swath angles, and the ship “attitude” – this is the position of the ship on Earth, including the ships’ various motions such as pitch (backward and forward movement), roll, heave and yaw. The velocity of sound in water is variable, and so it must be regularly checked every day to ensure the machines are calibrated properly. On average, sound travels through water at 1500 metres per second, but this value is variable and can be influenced by salinity of the water, depth and the temperature. The actual speed of sound in water can be determined in a variety of ways including SVP – Sound Velocity Profilers. These devices send sound waves across a very small and precise distance while immersed in the water column. Using the distance and the depth of the water column, scientists can mathematically determine the speed of sound at the current point in time. This value is then also entered into the bathymetry software. Today (22nd August) the speed of sound in the Coral Sea was calculated to be 1540.7 metres per second.
Once all of the above factors are taken into account, the depth of the sea floor can then be calculated. As long as the ship continues to move forwards, the swathing process can “paint” a picture of the deep sea floor. However, before final maps can be constructed from the sound data obtained, the raw data must be cleaned – scientists remove, often manually, any traces of unwanted “noise” or interference to ensure they produce the cleanest map profile possible.
In addition to the depth information, scientists also gather data about the quality of the sound returned – this is called backscatter. Upon its return, the sound comes back in a particular wave form, which typically looks like a bell curve – this return is transformed into pixels. A sharp hard bell curve return appears whiter in the backscatter image produced, and indicates that the ground being mapped is harder or rougher which can mean rocks or coarse sediment is on the seafloor. Smaller bell curves appear as darker patches on the backscatter image and can indicate areas of the sea floor that are softer. However, this data is not 100% accurate and there is ongoing research into the area of how to best interpret and use bathymetry backscatter data.
The first image below shows a bathymetry map of a sea mount, developed using onboard SONAR and swathing. This was obtained by the RV Investigator on August 12th. The bathymetry map on the left highlights the change in depth of the ocean floor beneath the ship, whilst the backscatter image (bottom left) shows that the surface of the sea mount being mapped is hard or rough in nature – this is indicated by the strong white colour on the image.
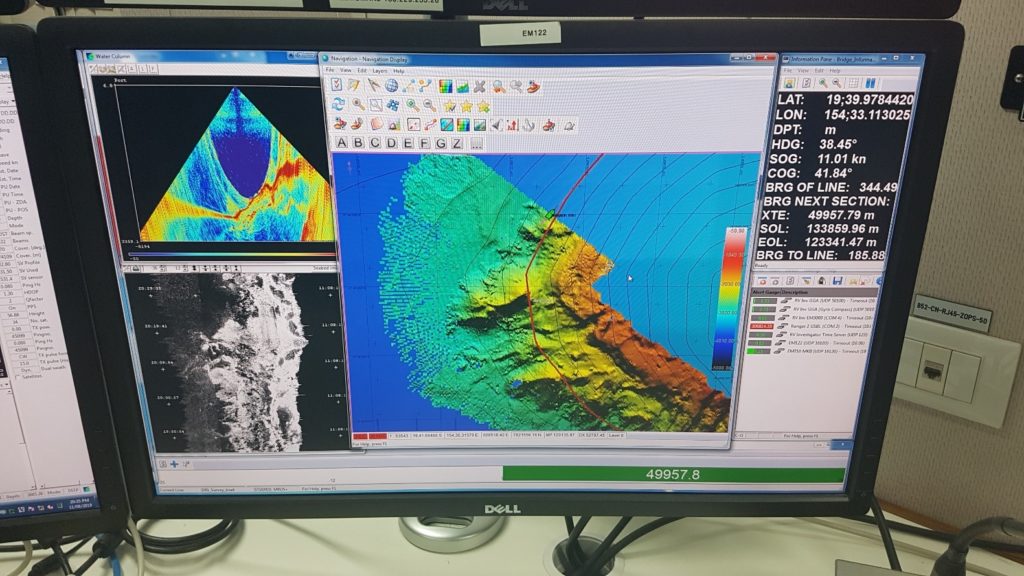
Image 1: Bathymetry of the sea floor (right) including backscatter (bottom left), taken 12/08/19. Taken by Olivia Belshaw.
The second image shows a bathymetry map obtained by the RV Investigator today – 22nd August. The map shows the sea floor is relatively flat, with some occasional lumps and bumps, and generally a depth of approx. 2.6km below the sea surface. The backscatter image indicates the surface is much softer than the previous example and is possibly made of muddy sediments – this is indicated by the much darker pixels in the image.
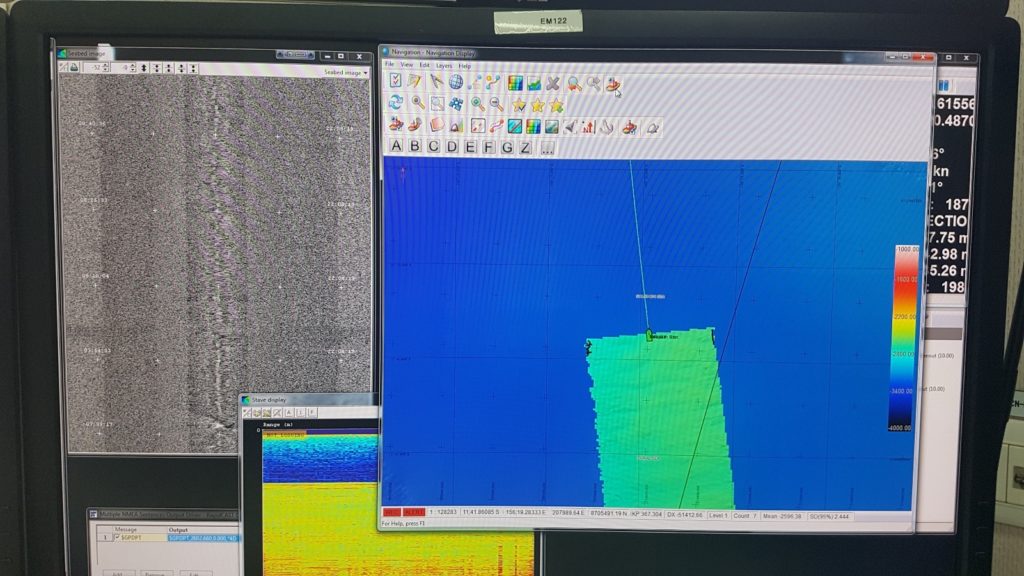
Image 2: Bathymetry of the sea floor (right) including backscatter (top left), taken 22/08/19. Taken by Olivia Belshaw.